Data Charts are Powerful Tools for Business Dashboards
Business Pivot Data Charts allow you to create dashboards with informative data visualization on finances, sales, key marketing indicators, and more. A creative approach to data diagrams creates a presentable infographic about statistics. Thanks to data visualization, we turn pivot tables into an engaging play of values. At the same time, visualization should not only be captivating but also practically applicable. A quality Business Dashboard should be able to easily tell a clear story without words.
Business Data Charts for Example Visualization
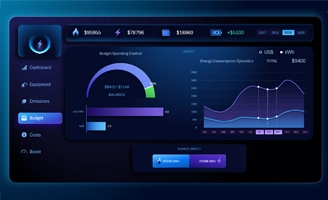 Budget-spending gauge and rate comparison in Excel.
An example of how equal kilowatts, different money on the budget gauge in the bakery dashboard reveal the real cost of energy for the business. Download the template in Excel format.
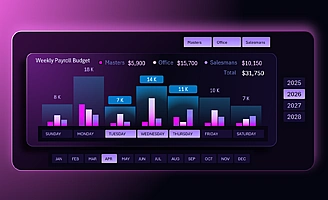 Clustered bar chart with grouped spending in Excel.
An example of how a single grouped chart reveals the weekly rhythm of spending across three employee categories at once. How to analyze weekly expenses in Excel by group.
 Dashboard for building personal capital in Excel.
A personal finance dashboard in Excel: how automating expenses and visualizing goals replace willpower — and work more reliably. How does automation help you build capital quickly?
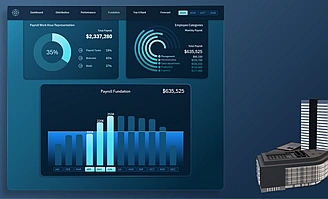
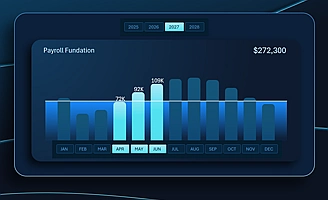 Dynamic Excel Bar Chart of Payroll Fund Contributions.
An interactive bar chart template for an Excel dashboard. A bar chart with a cursor and plan completion level for analyzing monthly payroll fund contributions.
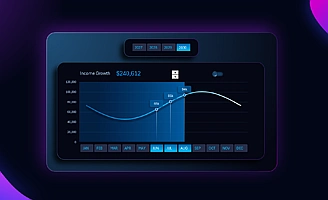 Combined Chart for KPI Plan Testing in Excel.
Testing KPI plans for revenue growth on an Excel dashboard. A combined actual vs. plan chart, plan line adjustment, KPI display toggle, and pivot table slicers — all in one block.
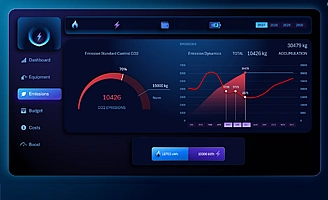 Excel Dashboard for Tracking Monthly CO2 Emissions.
Monthly CO2 emission dynamics accounting for biological dough emissions and indirect emissions from the diesel generator. What happens to the CO2 indicator in the visualization when gas metrics are switched off?
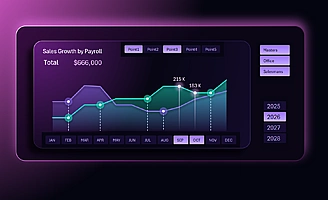 Sales Growth Oscillator Line Chart in Excel.
Breaking down the sales comparative analysis block in Excel: line charts by sales location, a growth point marking algorithm, line filtering, and interactive monthly slices — without the visual noise!
 Accrual Forecasting Line Chart Design in Excel.
A beautiful accrual forecasting visualization design on an Excel dashboard: line charts with markers and fill for evaluating salary and bonus growth while accounting for sales seasonality and development dynamics.
 New Radar Chart Design for Data Distribution in Excel.
An Excel radar chart for comparative analysis of KPI and MoM growth distribution across departments. How teal organizations evaluate the effectiveness of their payroll structure without a culture of pressure.
 Horizontal Ranking Bar Chart: Top-5 Salespeople in Excel.
An interactive Excel horizontal bar chart with auto-sort by salary or bonuses. How a Top-5 salesperson financial payout ranking chart helps rethink compensation strategy.
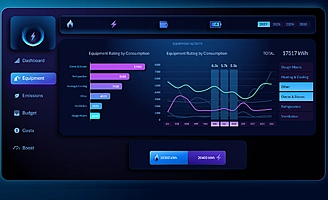 Excel Equipment Energy Consumption Ranking Charts.
Excel bakery dashboard block: an auto-sorted equipment ranking by gas and electricity consumption, a CO2 emissions gauge with a manually adjustable limit, and dynamic monthly emissions analysis.
 Orbit and Budget Distribution Spots in an Excel Radar Chart.
Introducing the Excel radar chart for analyzing salary and KPI bonus distribution by employee. The budget orbit ring, employee category toggles, and a detailed drill-down screen for in-depth analysis.
 Two Curves — One Philosophy on a Line Chart in Excel.
We break down the plan vs. actual payroll block on the dashboard. How do you visualize development bonuses in teal organizations? An example of how to configure month and quarter slicers and read the correlations.
 Payroll Fund Accrual Bar Chart in Excel.
A payroll fund accrual visualization block for an Excel dashboard. An interactive combined bar chart with a plan line, a month-selection cursor, and pivot table slicers for quarterly analysis.
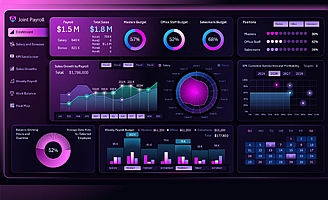
 KPI Dashboard for Startup Analysis in Excel.
Excel KPI dashboard template for startups: track revenue, team enthusiasm, and customer network growth with real-time plan adjustments. A survival tool for early-stage businesses — no complex software required.
 Energy Excel Dashboard for a Bakery.
Download the Excel energy dashboard template for a bakery: gas and electricity expense analysis by equipment, CO2 monitoring, budget management, and credit buffer tracking — all in one interactive file.
 Radar Chart for an HR Dashboard in Excel.
In this video walkthrough, we show how to build a radar chart in Excel to analyze the correlation between financial compensation and KPIs across employee categories. Includes a ready-made template with an example.
 Payroll Expense Management Dashboard in Excel.
An example of how to build an Excel dashboard for analyzing the ROI of workforce investments: from payroll budget allocation to ROI by employee category. Template, formulas, and step-by-step instructions included.
 Employee Leaderboard with sorting functionality in Excel.
Interactive employee ranking in Excel with Top 5 leaders for sales and marketing departments. Users can switch between departments to evaluate the impact of top performers on results.
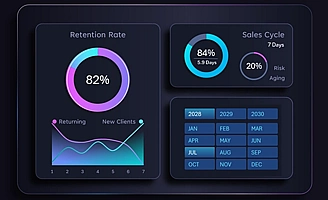 Line chart of customer churn and acquisition in Excel.
Analysis of customer retention and new customer acquisition in Excel using line charts. The intersection point of these charts represents the equilibrium point. Designed to evaluate marketing effectiveness.

Data Visualization Charts for Interactive Report Creation in Excel.
Dashboard Templates