Business Excel Dashboard Templates for Project Management
Interactive Excel Dashboard templates help business project managers track progress and performance, taking into account invested resources and costs. They make it easy to quickly identify growth opportunities and monitor process efficiency. With KPI data visualization, performance can be evaluated even at the business planning stage of investment projects.
Data visualization in Excel is a powerful tool for simplifying strategic decision making. Gain full control over business operations with interactive Excel Dashboards.
Excel Dashboard templates are perfect for monitoring business processes and addressing obstacles in a timely manner. Ready-to-use examples simplify reporting and support continuous performance improvement.
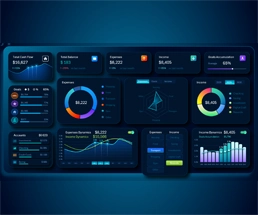
Excel Dashboards for Business Analytics
 Personal Finance Capital Accumulation Dashboard in Excel
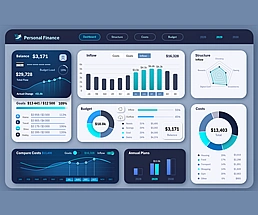 Excel Dashboard for Effective Personal Finance Management
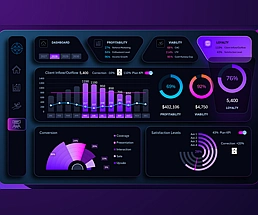 Excel Dashboard for Managing Customer Loyalty to Project
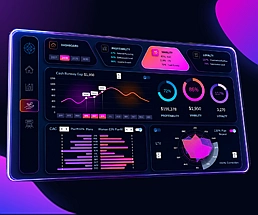 KPI Dashboard for Project Viability Management in Excel
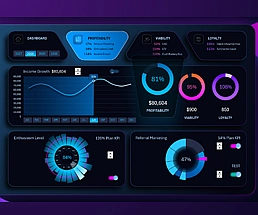 KPI Dashboard for Startup Project Management in Excel
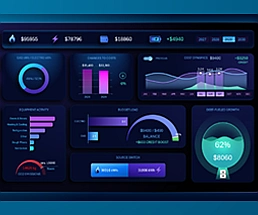 Excel Energy Dashboard for Bakery Project Management
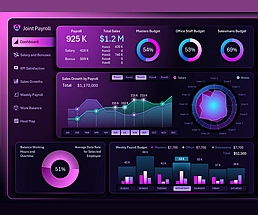 Excel Payroll Dashboard Example for Invest in Employees
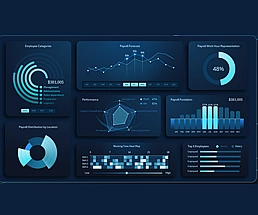 Excel Payroll Dashboard for Teal Organization Self-Management
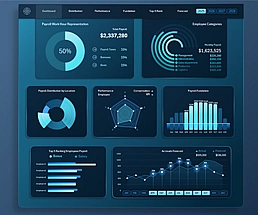 Big Dashboard for Payroll Fund Management in Excel
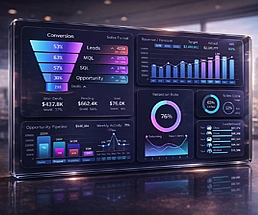 CRM dashboard for effective sales management in Excel
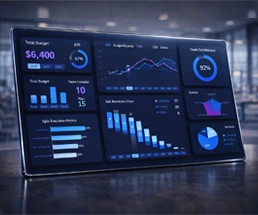 Epic Burndown Chart in Excel Dashboard Project Management
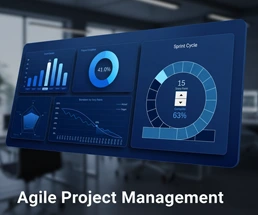 Sprint cycle for agile project management in Excel
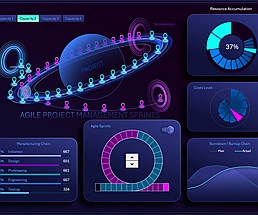 Showcase Agile Project Management Dashboard in Excel
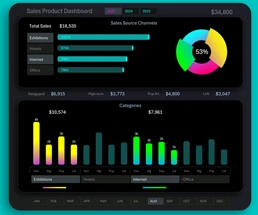 Simple and useful Excel Sales Dashboard for Small Business
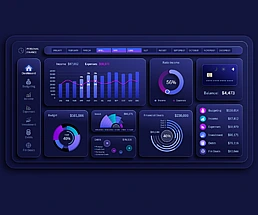 Best Dashboard for Personal Finance Management in Excel
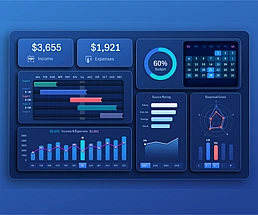 How to Manage Personal Finances in an Excel Dashboard
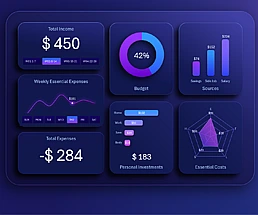 Excel Dashboard for Weekly Personal Finance expense track
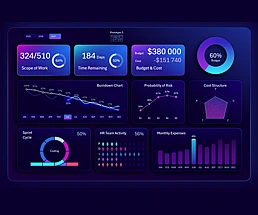 Agile Project Management Excel Dashboard for Personal Finance App
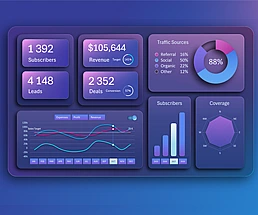 SaaS Sales Dashboard for Business Planning in Excel
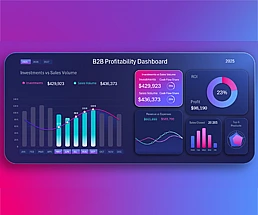 Excel Dashboard for analyzing product investment ROI
Data Visualization Charts for Interactive Report Creation in Excel.
Dashboard Templates