Download example dashboards for interactive analyzes in Excel
Free selection of examples of templates, dashboards and data visualization on charts with diagrams available for download.Links to download pages for examples
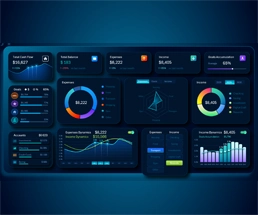 Personal Finance Capital Accumulation Dashboard in Excel.
An example of how to use a dashboard to rapidly capitalize personal financial assets through data visualization in Excel. Why does personal finance accumulate capital faster than a business?
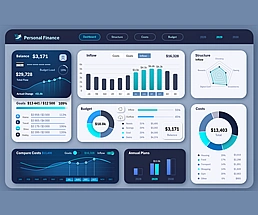 Excel Dashboard for Effective Personal Finance Management.
An Excel dashboard template for tracking expenses and building up capital for yourself. What's the secret to effectively managing daily processes to quickly achieve your personal financial goals?
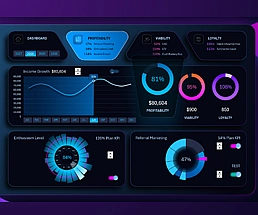
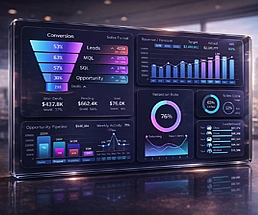
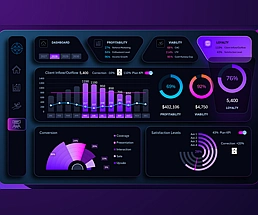 Excel Dashboard for Managing Customer Loyalty to Project.
A dashboard example for strategically planning KPI targets to boost customer loyalty toward a new business or startup. A strategy modeling tool built on data visualization.
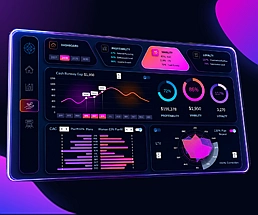 KPI Dashboard for Project Viability Management in Excel.
A dashboard template for presenting how to manage project survival in Excel. The formula for successfully monitoring the sustainability of a new business. What is a project and how do you define it?
 KPI Dashboard for Startup Project Management in Excel.
The dashboard template helps support startup projects at the very beginning of their lifecycle. Businesses need support at the start of the journey. What should KPI plans look like to serve as an effective performance benchmark?
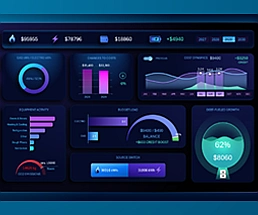 Excel Energy Dashboard for Bakery Project Management.
Dashboard template for tracking electricity and gas expenses in a bakery with the goal of reducing consumption by 25% and increasing business profitability. An example of how to double bakery profits using Excel.
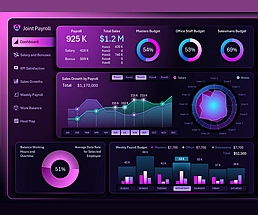 Excel Payroll Dashboard Example for Invest in Employees.
Payroll Dashboard Concept: Aligning Salary Investment with Sales Performance via Advanced Workforce Segmentation. Excel for Strategic Talent Investment.
 Excel Payroll Dashboard for Teal Organization Self-Management.
Prototype of interactive data visualization in Excel for self-managed companies. A dashboard design version for turquoise organizations to emphasize team corporate culture.
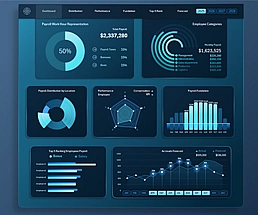 Big Dashboard for Payroll Fund Management in Excel.
Download a ready-made dashboard template for presenting an interactive report on payroll fund performance. An interactive control panel for managing financial compensation expenses.
 CRM dashboard for effective sales management in Excel.
An example template for creating interactive dashboard-style reports for your CRM system, taking into account all unique conditions, features, capabilities, and business needs.
Excel Dashboard Templates for Business

Data Visualization Charts for Interactive Report Creation in Excel.
Dashboard Templates