Coverage progress chart in Excel for achieving goals
Use a coverage progress chart to track the movement toward goals in Excel. Tracking goals becomes easier when progress is displayed clearly and visually. The coverage progress chart in Excel helps visualize the path to results for four goals simultaneously. This gives a better understanding of resource allocation efficiency and the current level of progress. This way, actions can always be adjusted on time.
Excel Template for Coverage Progress Chart to Track Goals
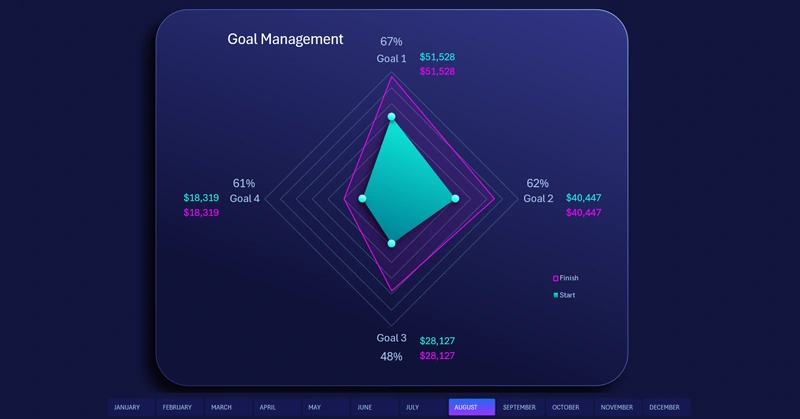
The chart can be used for different goals. For example, if your main goal is market coverage, it should be broken down into four objectives by directions (north, east, south, west). Each direction may have a different level of competition, and the objectives may vary. Therefore, in the source values, set different satisfactory targets for each direction. The chart helps you track monthly progress. This approach makes goal achievement more manageable and motivates forward movement, especially for goals that have already passed 51%, which is clearly visible visually.
To understand the principles and practical use of the coverage progress chart for achieving desired goals, download the ready-made template at the end of the article. Even better, learn to create such templates yourself in Excel. The video tutorial shows step by step how to:
- First, create a radar chart template in Excel.
- Add a data series to create large circular markers.
- Create a shape for the background design of the visualization block.
- Set the fill colors for different layers of the chart.
- Add pivot table slicer buttons for interactive control.
- Test the interactive coverage chart functionality in Excel.
You can use the coverage chart to analyze the progress of multiple goals simultaneously on an interactive dashboard:
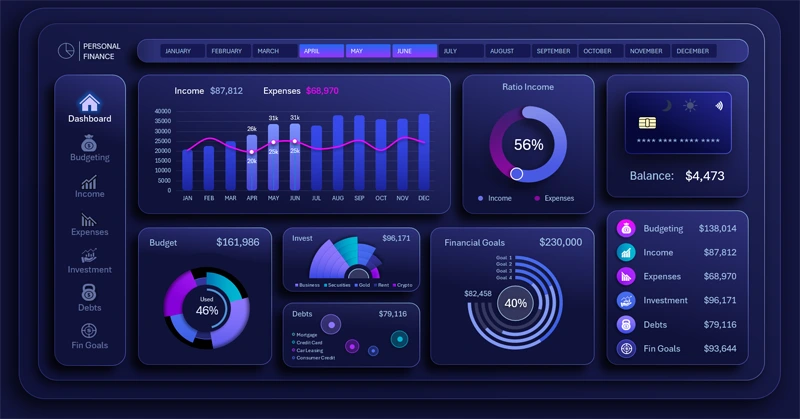
Dashboard for Achieving Personal Finance Goals in Excel
The coverage progress chart in Excel makes goal tracking clear and transparent. It helps visualize actual results, increases motivation, and supports informed decision-making. Add this visualization to your reports to make tracking the path to important achievements easier.


Data Visualization Charts for Interactive Report Creation in Excel.
Dashboard Templates