Excel Data Manipulator Chart for Interactive Forecasting
Want to see your data come to life under your control? Here is an Excel bar chart with the ability to manipulate data directly on the chart. This visualization template not only displays information but also allows useful interaction with it. Change input data, test scenarios, and instantly view projected results on the dashboard. This gives you the ability to think visually for more accurate forecasting. This approach to data visualization helps you fully leverage your intuitive abilities.
Bar chart with data manipulation in Excel
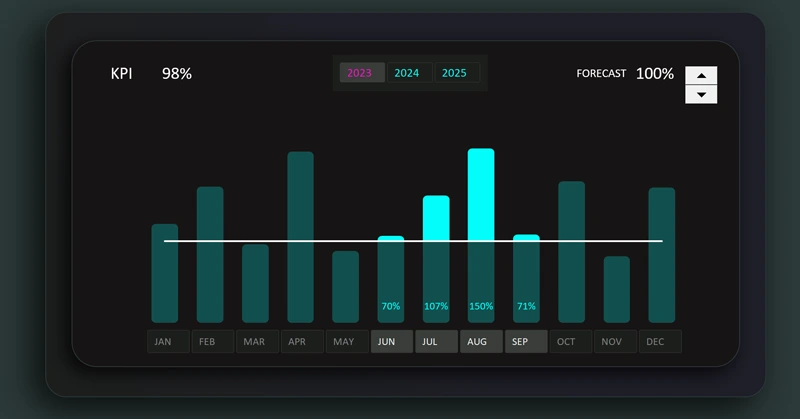
Humans perceive graphical information much more effectively than text. It is also easier for people to think in visual images rather than numerical values. This bar chart allows you to manipulate the bars to more effectively answer the key question: "What if…?"
You can download a ready-made template at the end of the article, or even better, learn to create such interactive data visualizations in Excel yourself. The tutorial video shows:
- Base formulas for the interactive bar chart.
- Create a clustered bar chart template and configure its settings.
- Add pivot table slicer buttons to control the bar chart.
- Create the design for the data visualization block.
- Add and edit shapes for functional column design in the chart.
- Add a KPI target control element.
- Arrange and configure all control elements in their proper places.
- Example of data manipulation for forecasting KPI results in Excel.
It’s even better to create entire dashboards with such charts, as shown in this example:
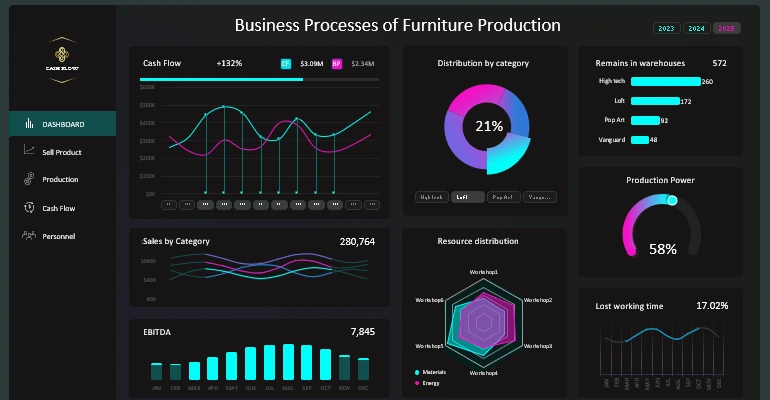
5 Excel dashboard screens for business analysis
Expand your thinking and intuitive abilities to achieve the most accurate forecasting possible. Excel data visualization will always help you in this.


Data Visualization Charts for Interactive Report Creation in Excel.
Dashboard Templates