Employee Leaderboard with sorting functionality in Excel
Employee performance evaluation is a critical component of team performance management. An interactive leaderboard in Excel allows you to highlight top performers for a selected period and objectively compare the contributions of different departments. This type of tool reduces subjectivity in evaluation and increases transparency in analytics.

In any company, there is often tension between marketing and sales departments. When sales decline, marketers blame sales teams for poor customer handling, while sales teams blame marketing for low-quality leads and targeting. When sales grow, each department tends to claim full credit. This is a familiar challenge for many business owners.
A Top 5 employee ranking table in Excel provides the ability to switch between sales and marketing departments, displaying both absolute and relative performance metrics depending on the selected unit.

For the sales department, absolute values such as total revenue are used. For the marketing department, relative percentages based on KPI achievement are applied. It is difficult to determine exactly how much revenue a single marketing employee generates, but their impact on overall performance is undeniable.
See how seamlessly the leaderboard integrates with other visualization blocks within a single dashboard:
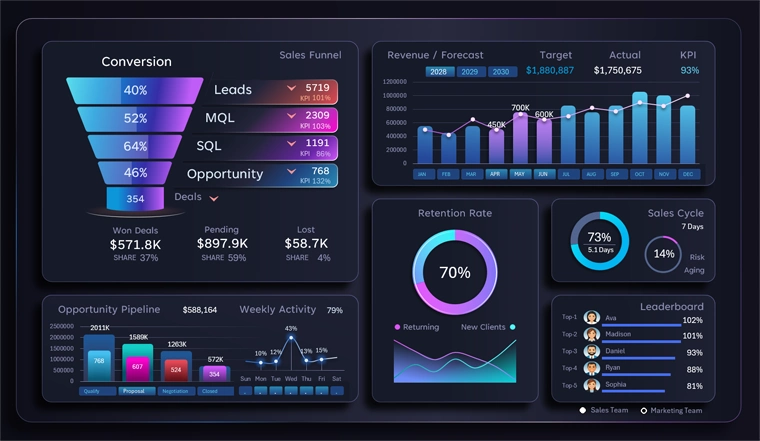
CRM dashboard for presenting marketing and sales performance in Excel
An interactive employee ranking not only identifies top performers but also enables a fair comparison between departments using relevant metrics. Applying absolute indicators for sales and relative KPIs for marketing creates a more balanced analysis. This approach helps reduce internal conflicts, improves objectivity, and keeps teams focused on achieving shared business goals.
 Download the leaderboard with sorting functionality in Excel

Data Visualization Charts for Interactive Report Creation in Excel.
Dashboard Templates