Excel CRM Dashboard for sales analysis in Small Business
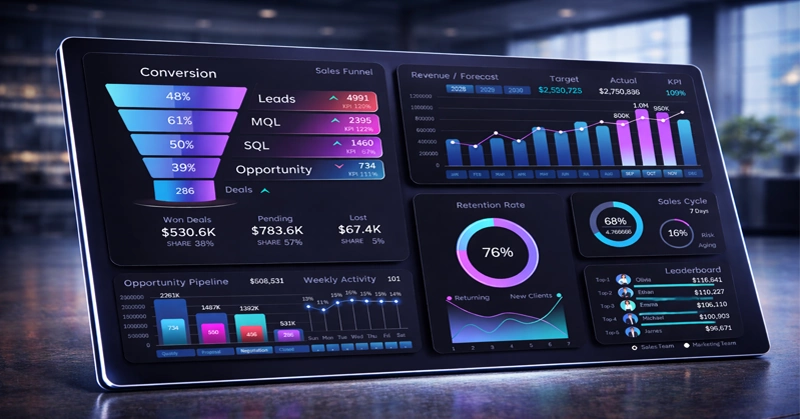
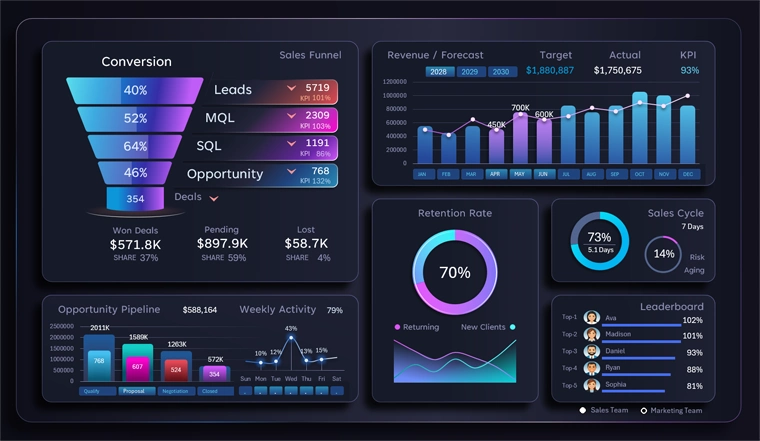
Effective sales management requires not only data collection but also structured interpretation. A CRM dashboard in Excel allows you to consolidate key metrics, visualize the sales funnel, and track deal dynamics within a single interface.
How Excel Expands CRM System Capabilities for Sales Management
Thanks to the flexibility of Excel as a universal tool, companies can quickly adapt analytics to their specific business processes and gain up-to-date insights without complex implementations. When is this relevant? In cases where there is an urgent need for a non-standard report that may never be required again. There is no point in spending resources on developing one-time reports. Simply use Excel to effectively present a unique report with interactive capabilities. Excel is also highly useful for prototyping missing reports, significantly accelerating the development of CRM system enhancements that account for non-standard business requirements.
An interactive CRM dashboard in Excel with sales funnel visualization presents key performance indicators thanks to Excel’s low entry barrier. By mastering a few core functions, managers gain new capabilities for their work:
- track the dynamics of their deals
- segment customers by funnel stages
- create informative reports in a structured, analytical style.
Behind the impressive dashboard design are only standard Excel tools for interactive data visualization. The premium look is achieved through a well-chosen color palette. At its core, it is still Excel with pivot tables, charts, and formulas. Interactivity is powered by slicer filter buttons, which control pivot tables, and in turn, the charts. If this simplicity does not convince you, watch the training video where each visualization block is built step by step:
- Main grid template
- Sales funnel for managing lead-to-deal conversion
- Monthly revenue analysis and forecast
- Visualization of sales funnel stages in Excel
- Customer retention and acquisition analysis
- Sales cycle analysis
- Interactive leaderboard in Excel
If the video still does not convince you that building a CRM dashboard in Excel is accessible, use a ready-made template to understand how all elements are structured in practice. You can download the sample template at the end of the article.
For full understanding, read the guide on using the CRM dashboard in Excel, where each chart and its purpose is described in detail.
Structure of a CRM dashboard for analyzing sales performance in Excel
Using Excel as a complement to a CRM system opens new possibilities for analyzing and controlling sales. Interactive dashboards help address specific analytical needs in rare or urgent situations involving non-standard data scenarios. A manager gains the ability to:
- Analyze data faster and identify anomalies.
- Eliminate bottlenecks in the funnel.
- Evaluate team performance.
- Make data-driven decisions.
This approach makes sales management more transparent, flexible, and results-oriented.
 Download the CRM dashboard template for sales analysis in Excel

Data Visualization Charts for Interactive Report Creation in Excel.
Dashboard Templates