Excel Mini Dashboard control panel using buttons Template
The dashboard control panel in Excel plays a key role in organizing analytics and interacting with data. An interactive control panel in Excel with manager selection buttons and time period switches. This visualization block also includes budget balance indicators, a column chart ranking completed tasks by managers, and KPI visuals that display plan execution on the dashboard.
How to Use an Interactive KPI Control Panel in Excel
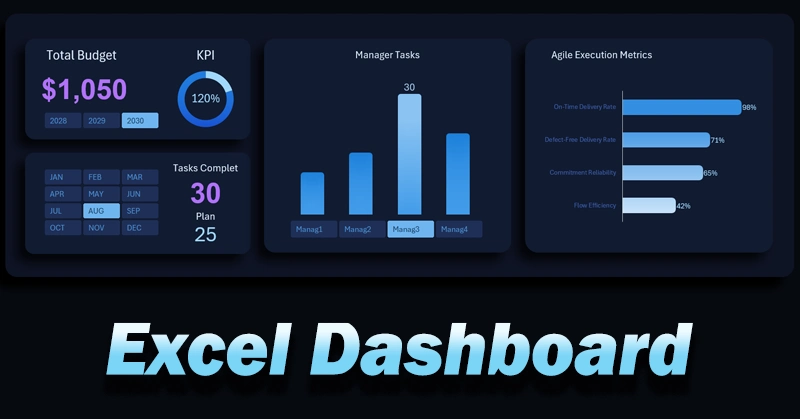
First of all, the panel is designed for use in interactive dashboards built in Excel, as well as for visual reports or presentations. It combines:
- Filtering elements using Excel pivot table slicer buttons.
- Key metrics and visual indicators.
- A switch between metrics for each individual manager.
- Functions for managing reporting periods and selecting data for metric analysis.
This approach ensures a holistic perception of data and improves the effectiveness of management decisions.
Notice how harmoniously the control panel fits into the business intelligence dashboard design created with standard Excel tools:
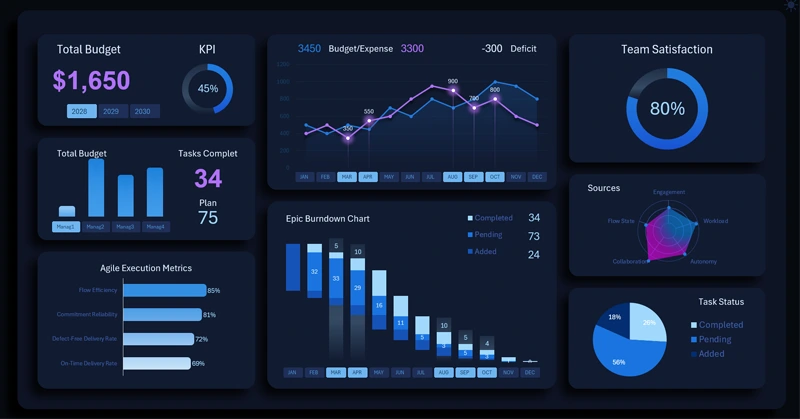
Dashboard template for Agile project management in Excel
A well-designed control panel transforms a dashboard into a полноценный tool for analysis and control. Interactive elements enable flexible data management, task tracking, and real-time evaluation of team performance. Additional metrics and automatic ranking enhance analytical depth, helping identify strengths and weaknesses in processes and improve overall project performance.
 Download the Excel dashboard control panel template
Data Visualization Charts for Interactive Report Creation in Excel.
Dashboard Templates