Excel Project Roadmap Chart for Beautiful Dashboards
The interactive roadmap in Excel is an excellent tool for visualizing project progress. Use our template to quickly start creating a dynamic roadmap chart in Excel. It will give your dashboards a stylish and functional design.
Dynamic roadmap template for project management in Excel
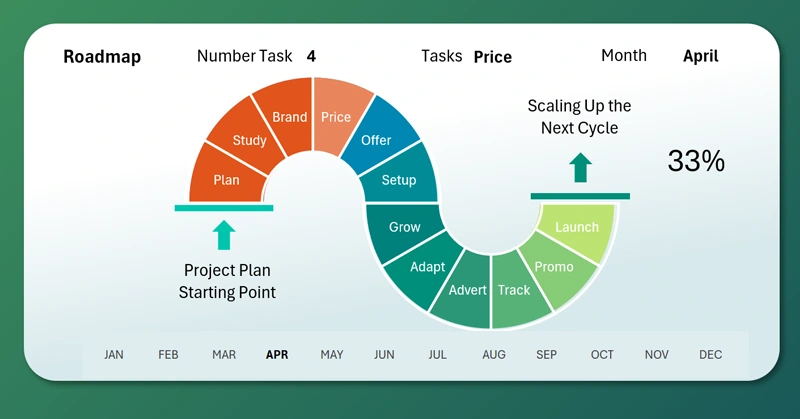
When developing project management dashboards, it is very important to use a visualization element such as a roadmap. Download our template, and it will help you quickly understand how the chart works in practice. The principle of building an interactive roadmap in Excel is simple—it is based on a combination of multilayered charts. To master the theory, watch the tutorial video at the end of the article.
This video shows how to combine several pie charts, adjust data layers, and create an interactive roadmap monitoring dashboard for project tracking and presentation. Video tutorial structure:
- The first pie chart for building the first part of the roadmap.
- Adding another data series to create an interactive cursor.
- The second pie chart for the second half of the roadmap chart.
- Customizing the design according to the color scheme.
- Adding pivot table slicer buttons to control the chart.
- Adding a few more pie charts and decorating the visualization.
- Presentation of the interactive roadmap chart capabilities in Excel.
This visualization block with the roadmap chart is effectively used in the dashboard:
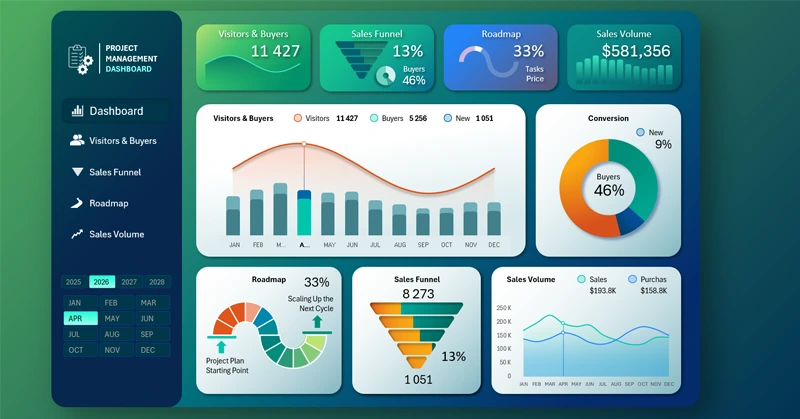
Download a beautiful project management dashboard in Excel
This combined approach to creating custom data visualization in Excel will help you transform static data into a clear project monitoring panel. The template is perfect for presentations and progress reporting.


Data Visualization Charts for Interactive Report Creation in Excel.
Dashboard Templates