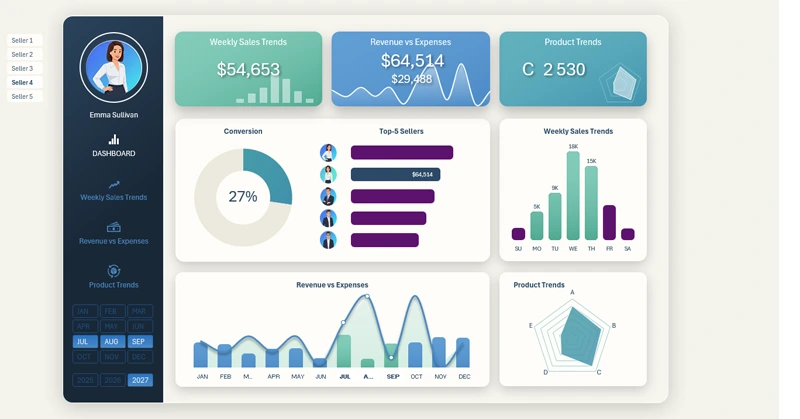
Excel Salesperson Evaluation Dashboard for Retail Stores
POS systems for retail stores collect large volumes of sales data. However, plain tables don’t give a complete picture for each salesperson. In this example, you'll see how Excel can be used to create an interactive dashboard that allows you to quickly assess employee performance.
What Data the POS Salesperson Dashboard Uses
We won’t go into development complexities — we’ll simply show a ready-made template example and explain the key visualization elements. Minimum words, maximum action and results. If you want to use this template, you can download it at the end of the article. If you want to learn how to build such dashboards, a video tutorial with step-by-step instructions is available. Here's the structure of the first part of the tutorial:
- Beautiful dashboard grid design with a 3D depth effect.
- Design for Excel dashboard KPI cards.
- Minimalist logo design.
- Adding main menu items with built-in icons from Excel's library.
- Working with source data and creating pivot tables.
- Adding the first dashboard control elements.
- Chart for presenting lead-to-sale conversion rate.
- Horizontal bar chart of salesperson ranking sorted in descending order.
- Animated salesperson photo cards aligned with the Y-axis ranking in the bar chart.
- Slider to update the photo when selecting a salesperson in the logo area.
- Combined interactive chart for revenue vs. expenses.
- Bar chart to analyze monthly revenue distribution by weekday.
- Radar chart to analyze product category sales distribution.
- Adding a button block to switch between years on the dashboard.
- Adding thumbnails and sparklines to KPI cards in the header menu.
- Presentation of Excel's data visualization capabilities for sales dashboard development.
We also recommend watching the second and final part of the video tutorial, where all the dashboard screens are created:
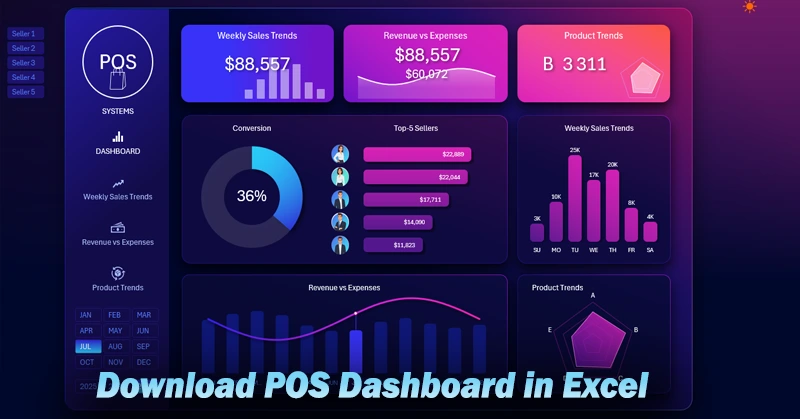
- Creating a light-theme dashboard grid template in Excel.
- Vertical menu for switching between dashboard screens.
- Lead conversion chart.
- Sorting salesperson photos for the ranking.
- Horizontal bar chart for revenue-based salesperson ranking.
- Buttons to switch between salespeople.
- How to make a photo slider in Excel.
- Weekly sales trend bar chart.
- Combined revenue and expense bar chart.
- Radar chart for product category sales distribution.
- Dashboard control panel.
- Interactive design for KPI cards.
- Revenue distribution screen by weekday.
- Screen for analyzing income, expenses, and profit.
- Screen for detailed analysis of product sales volume by category.
- Interactive menu functions for switching between screens.
- Presentation of the light design POS dashboard in Excel.
To understand the principles of practical use of the dashboard for POS systems, check out the usage guide:
How to Use the POS Dashboard with Salesperson Filter in Excel
A well-structured Excel dashboard helps retail store managers to:
- Quickly identify top-performing salespeople.
- Detect and analyze key factors in sales growth or decline.
- Design effective employee incentive programs.
Use the provided template to simplify reporting and make sales management more efficient.
Download the Salesperson Evaluation Dashboard for Retail Stores in Excel 

Data Visualization Charts for Interactive Report Creation in Excel.
Dashboard Templates