Horizontal Ranking Bar Chart in Excel with Sorting
The horizontal bar chart is convenient for displaying data rankings. This type of visualization makes it easy to compare values across related indicator categories. Sorting enhances the visual effect. The chart immediately highlights strong and weak positions.
Ranking Chart Template with Descending Sorting in Excel
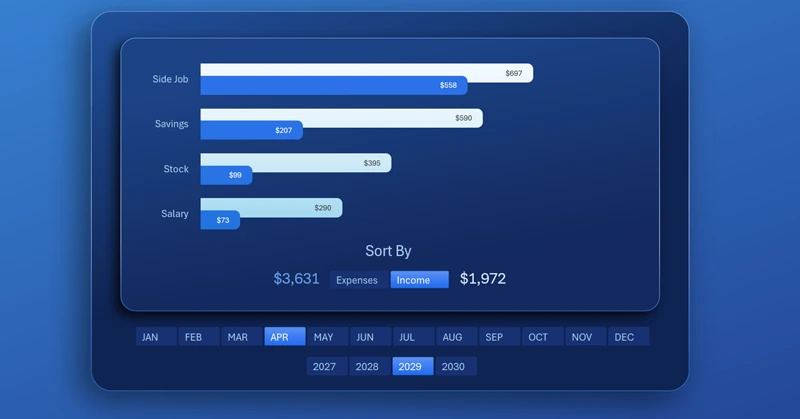
To switch between income and expense categories, slicer buttons from pivot tables are used. The SORT function is applied to sort the values themselves. To quickly understand everything, download the ready-made template and watch the tutorial video. It shows how to build a horizontal bar chart in Excel with dynamic sorting of income or expense indicators in descending order. Video lesson structure:
- First create a pivot table for visualization control elements.
- Add pivot table slicer buttons and manage the data.
- Use the SORT function to sort the source data and reference the toggle switch in the argument.
- Customize the parameters and design of the slicer buttons.
- Based on the sorted values, create a horizontal bar chart.
- Adjust basic parameters for your data display conditions.
- Create a shape for the visualization block background design.
- Format the appearance of the horizontal chart with rounded bars.
- Add additional pivot table slicers for switching between years and months.
- Work with the ranking sort toggle for descending income or expense indicators.
This chart can be effectively used for an interactive dashboard or presentation:
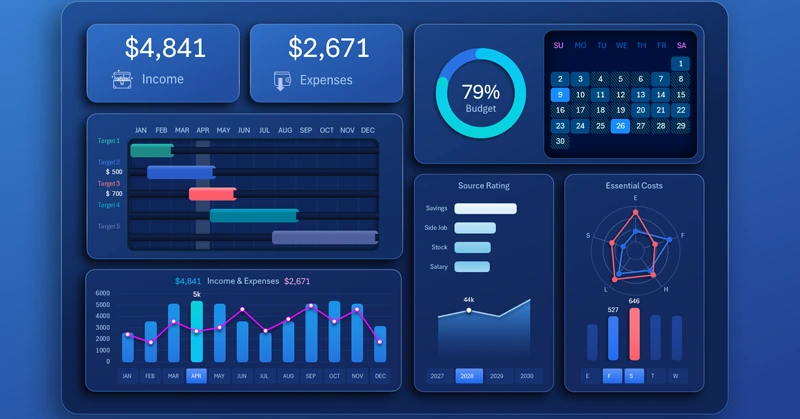
Dashboard for effective personal finance management in Excel
The horizontal bar chart with sorting makes ranking analysis fast and clear. This chart helps identify key positions and make correct decisions based on facts. Use it in reports and dashboards to improve data visualization and make indicators easier to interpret.


Data Visualization Charts for Interactive Report Creation in Excel.
Dashboard Templates