Spaghetti Line Chart for a Mini-Dashboard in Excel
The spaghetti chart in Excel helps visually display changes across multiple metrics simultaneously. By adding interactivity, you can easily control data display, making a compact dashboard more informative and easier to interpret.
Interactive spaghetti line chart template in Excel
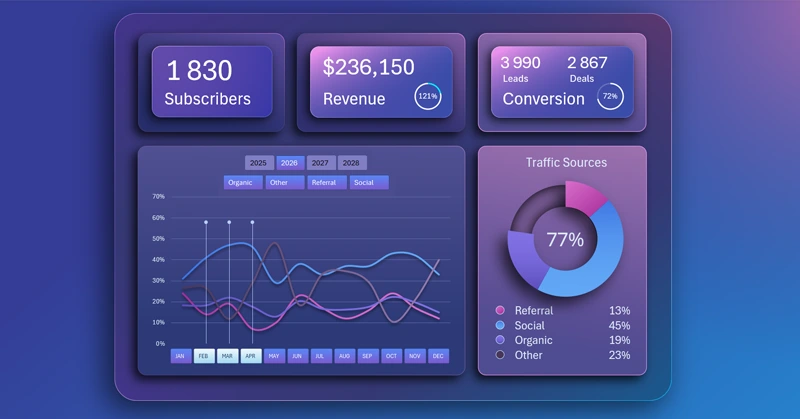
The main advantage of a spaghetti line chart is the ability to compare trends across multiple metrics at once. The main drawback is information overload. The more metrics compared simultaneously, the harder it is to read the visualization. It’s practical to allow the user to temporarily hide some lines on the chart. This way, you can analyze overall trends across all metrics while also focusing on 2–3 specific metrics in detail on the same data visualization block.
This approach significantly expands analysis capabilities and manages both the benefits and drawbacks of spaghetti line charts. To learn how to create interactive features for hiding lines yourself, use the ready-made Excel template. Additionally, study the step-by-step video tutorial that demonstrates the sequence of actions for building an interactive spaghetti chart in Excel. The tutorial includes the following development steps:
- Color palette for two-layer background gradients.
- Shape for the dashboard base with two-layer gradient fill and shadows.
- Design for dashboard grid blocks.
- Organize block placement and set sizes.
- First dynamic formula table for the interactive chart.
- Processing source data and building pivot tables.
- Fill the source table with dynamic GETPIVOTDATA formulas.
- How to create a stylish design for a ring chart in Excel.
- Dynamic data labels with formulas.
- Create the source formula table for the spaghetti chart.
- Auxiliary pivot table for toggling lines on the chart.
- How to create an interactive spaghetti line chart in Excel.
- Create a new template for a harmonious slicer button design for pivot tables.
- Fill KPI cards with dynamic labels and infographics.
- Presentation of mini-dashboard capabilities in Excel.
The spaghetti line chart can also be used on large multi-screen dashboards:
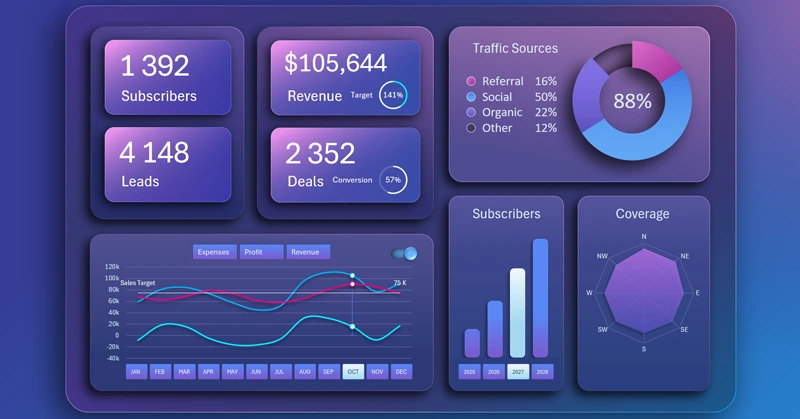
BI dashboard for SaaS sales business planning in Excel
The interactive spaghetti chart makes a compact dashboard informative and user-friendly. This chart helps compare trends across multiple metrics and quickly identify key patterns.


Data Visualization Charts for Interactive Report Creation in Excel.
Dashboard Templates