Visualization of final stage of sales funnel in Excel
At the final level of the sales funnel—the Opportunity stage after passing through all funnel levels—key responsibility shifts from the marketing department to the sales team. This is where the flow of potential customers is converted into actual deals.
How to Analyze Sales Behavioral Factors Using Excel
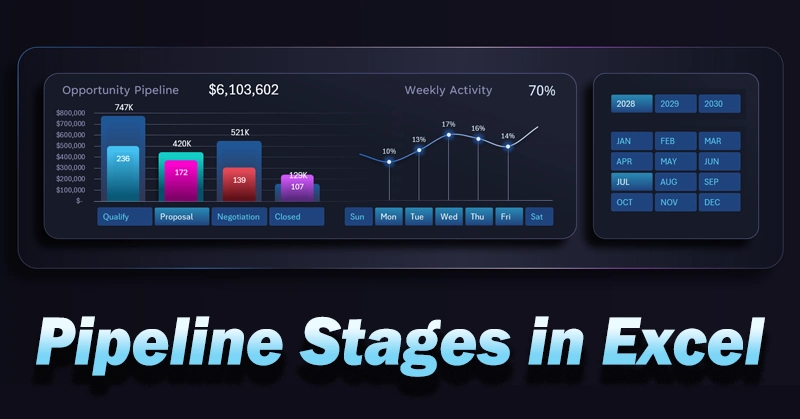
A two-level column chart in Excel displays deal value and deal count across internal stages:
- Qualification.
- Proposal.
- Negotiation.
- Contract.
As a useful addition, sparklines are included for quick analysis of sales activity by days of the week in the background.
At the final stage of the funnel, the customer проходит internal steps toward successful deal closure. The visualization represents a decomposition of the journey, guiding the customer from marketing to sales like a map. At each stage, a certain level of behavioral metrics is collected, which can reveal insights about the effectiveness of business interactions with the customer.
Depending on combinations of metrics at each stage, the responsible manager makes tactical or strategic decisions. This is not a game of poker, even if it may seem so at first glance. Visualization increases awareness and enhances the ability to better understand customer needs and anticipate expectations through behavioral patterns. As a result, the customer experiences satisfaction in each interaction, both with individual sales representatives and the business as a whole. This is a powerful opportunity to strengthen your brand. And remember, every business has a brand—even the smallest one—because a brand is defined by customer perception.
This visualization of the final stage of the sales funnel allows you to:
- Analyze the process structure in detail.
- Control deal value and quantity.
- Track team activity dynamics.
To get the full picture, we recommend reviewing the guide on using a CRM dashboard with a sales funnel and the practical application of this final-stage visualization block:
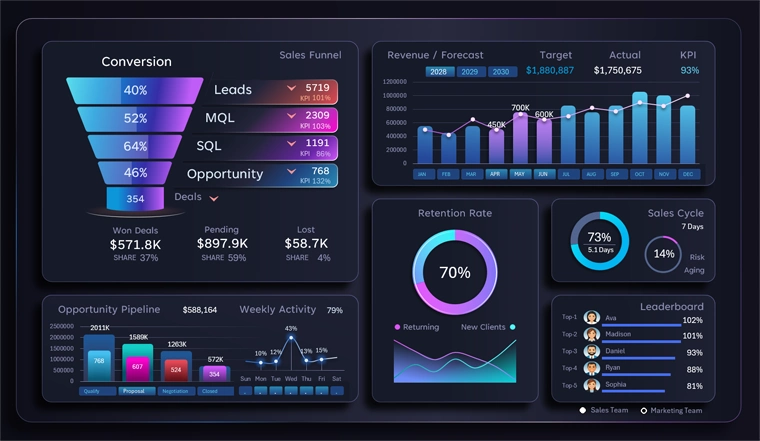
CRM dashboard template with funnel for sales management in Excel
It provides detailed explanations of all charts and their practical applications for small and medium-sized businesses.
Deep visualization of the final Opportunity stage helps identify real leverage points for improving conversion and sales efficiency. Separating metrics into deal value and deal count provides a clearer understanding of funnel structure, while analyzing activity by day of the week helps optimize workflows. This tool makes sales management more precise, flexible, and predictable, with a clear focus on achieving results.
 Download the final stage sales funnel template in Excel
Data Visualization Charts for Interactive Report Creation in Excel.
Dashboard Templates