Sensitivity analysis of the investment project download in Excel
The analysis of sensitivity is the dynamics of changes in the result depending on changes in key parameters. That is, what we get at the output of the model changing the variables at the input.
Investors and business managers have special interest in this type of analysis. Its results have particular value in business project analytics. Excel allows you to analyze the sensitivity of investment projects for users with basic knowledge in finance.
Sensitivity analysis method
The analyst's task is to determine the nature of the result dependence on variables and their threshold values when the model's conclusions are no longer supported.
The sensitivity analysis method is a method of enumeration: parameter values are successively substituted into the model. For example, we want to find out how the value of a firm will change when the production costs are changed within the range of 60-80%.
The inverse method is also used when the result of the model at the output adapts to a change in the values at the input.
The main target measurable indicators of the financial model:
- NPV (net present value). The main indicator of the profitability of the investment object. It is calculated as the difference between the total amount of discounted incomes and the volume of the investment. It is a prognostic assessment of the economic potential of the enterprise in the case of the adoption of the project.
- IRR (internal rate of return). Shows the maximum requirement for an annual return on the invested money. How much an investor can put into his calculations to make the project attractive. If the internal rate of return is higher than the expected return on capital, then we can talk about the effectiveness of investment.
- ROI / ROR (coefficient of profitability/return on investment). It is calculated as the ratio of total profit (taking into account the discount factor) to the initial investment.
- DPI (Discounted profitability index). It is calculated as the ratio of net present value to initial investment. If the indicator is greater than 1, the investment of capital can be considered as effective.
As a rule, these indicators are the results for which the sensitivity analysis is carried out. Naturally, if necessary, the sensitivity of other numerical calculation factors is determined. The number of variables can be any.
Sensitivity analysis of the investment project in Excel
The task is to analyze the main indicators of the effectiveness of the investment project. For example, let's take the provisional figures.
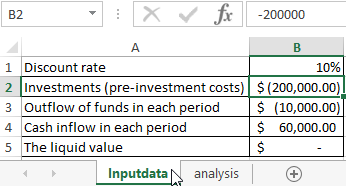
Input data:
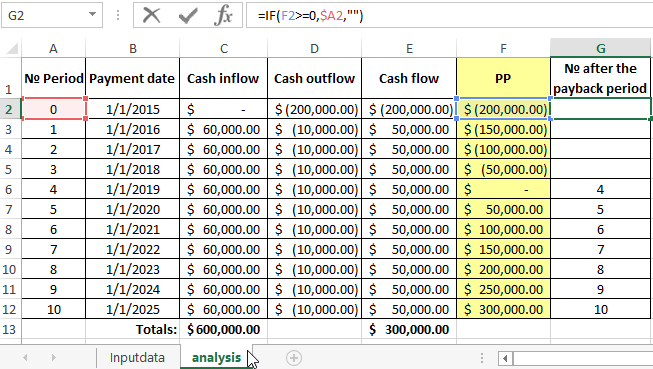
We start filling out the table for analyzing the sensitivity of the investment project:
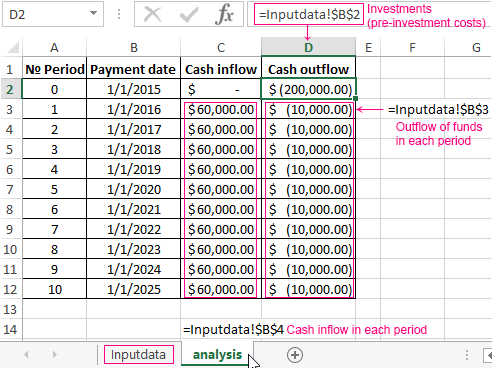
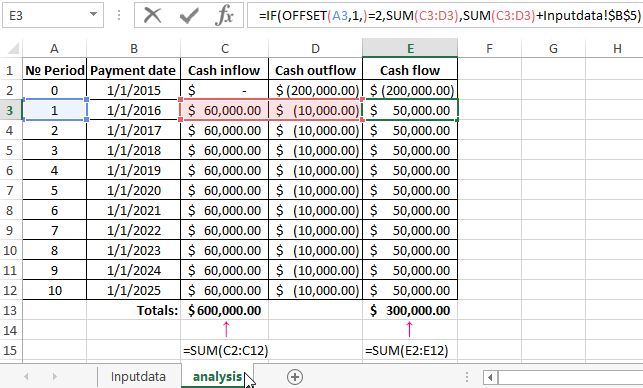
- Let’s calculate the cash flow. We need the function OFFSET since we have a dynamic range. In the calculation, we take into account the liquidation value (in our example it’s 0 and unknown). The calculation will be made without dates. That is, they will not affect the results. The cash flow in the "zero" period is equal to pre-investment sum. In the following periods:
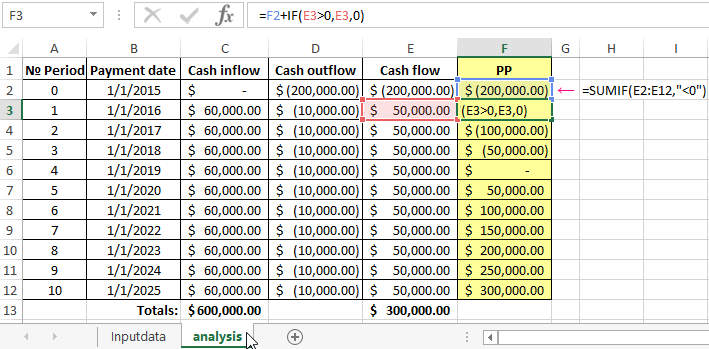
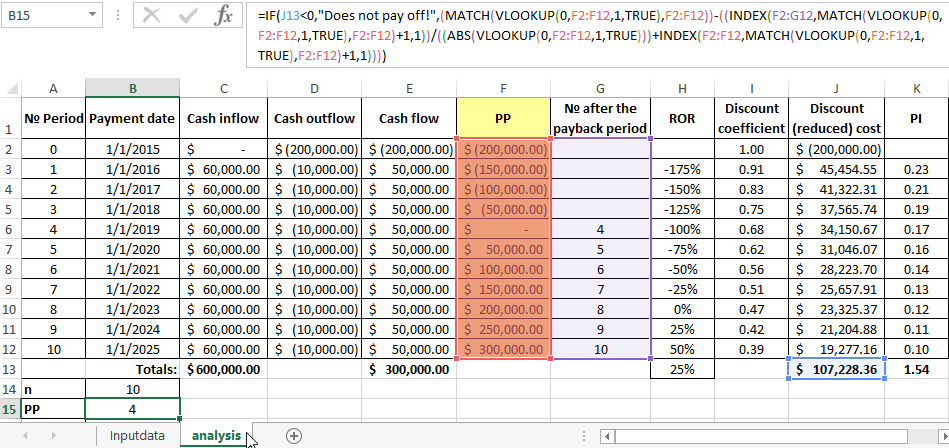
- We create an additional column to calculate the payback period of the investment project (PP). During the investment period, all additional investments will be added, exclusive of the profits from the amount of invested financial resources. Formula for the "zero" period: The formula for subsequent periods: , where F2 is the profit of the previous period (the value in the cell above). E3 is cash flow in a given period (the value of the cell on the left).
- Now we will find out when the project will start to make a profit or find break-even point: , where F2 is the profit in the current period (cell value on the left). A2 is the number of the current period (the first column).
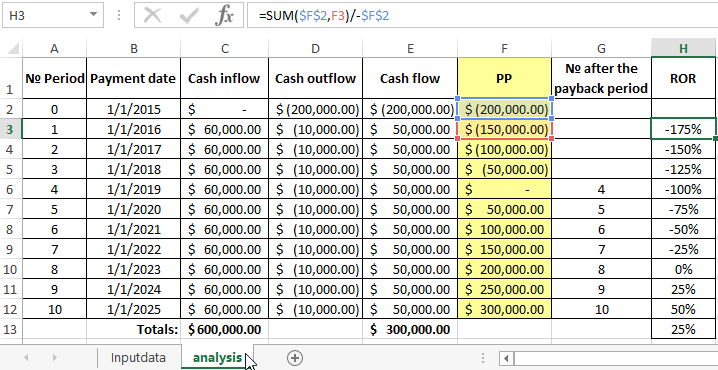
- We will find profitability of investments. This is the ratio of profit in the current period to pre-investment money amount. The formula in Excel:
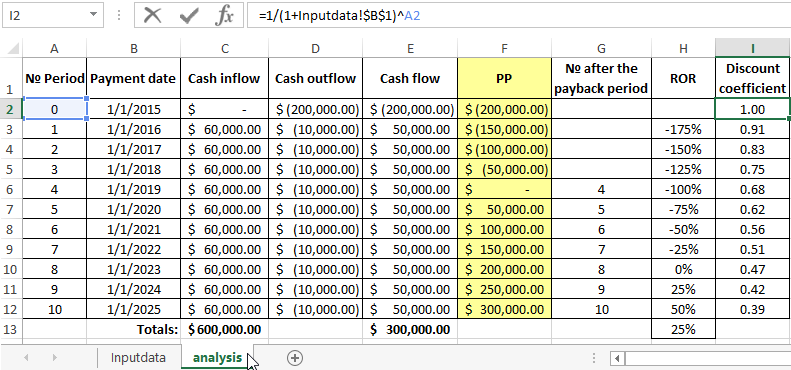
- We calculate the discount factor. The formula for our example (where dates are not counted): , where B1 is a cell with a percentage of the discount rate. A2 is the period number.
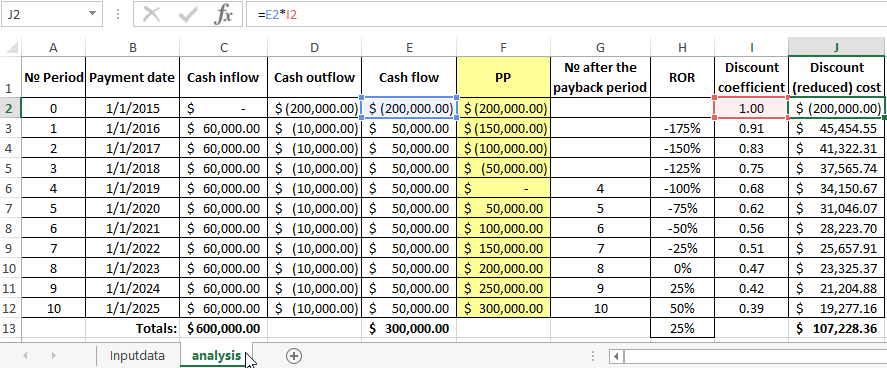
- We will find the discounted (reduced) cost. This product is the value of the cash flow in the current period and the discount factor. Formula:
- Let's find the profit/investment ratio discounted. Its abbreviation is PI. This is the ratio of discounted cost to initial investments. The formula in Excel:
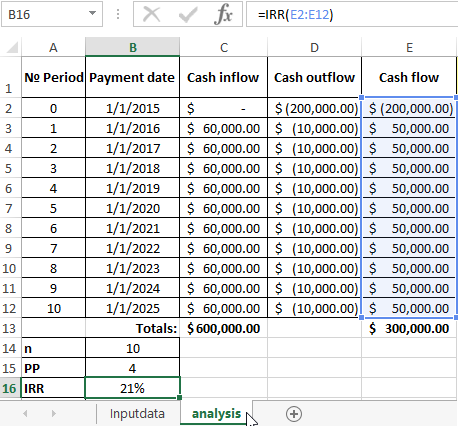
- Let’s find the internal rate of return (IRR). If the dates are not taken into account (as in our example), we use the built-in IRR function. Function: =IRR(E2:E12). If the dates are taken into account, then the function XIRR will work. Let’s calculate PP which is the payback period of the project (PP). Or we take the data from the table. For this purpose, we use inserted functions:
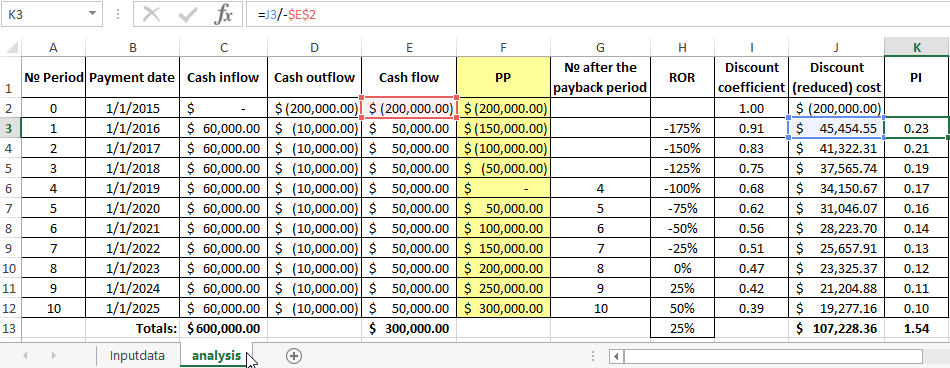
Let's sum up:
- the project term is 10 years;
- net present value (NPV) is 107228 rubles. (Without taking into account the payment date, taking all periods equal);
- to find this value it is possible to use the built-in functions of the NPV and PV (for annuity payments);
- discounted profitability index (PI) is 1.54;
- return on investment (ROR) is 25%;
- the internal rate of return (IRR) is 21%;
- payback period (RR) is 4 years.
An Excel spreadsheet with an example and formulas can be viewed by downloading a file with a ready-made example:
Download sensitivity analysis of the investment project
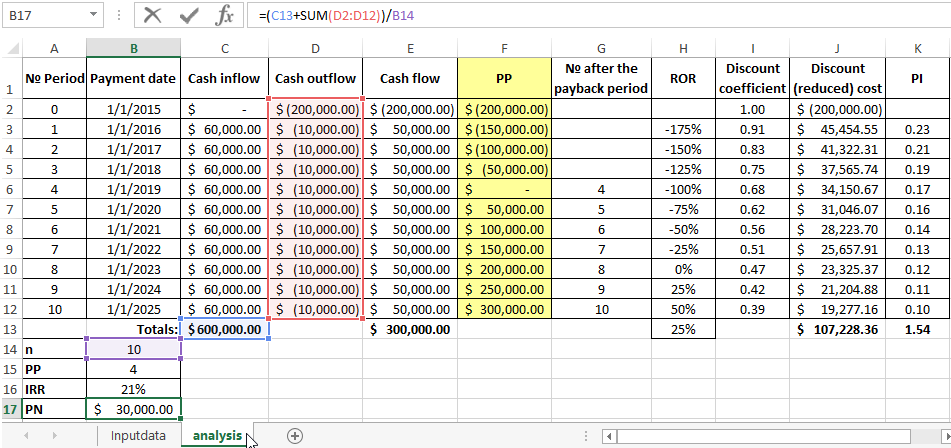
You can also find the average annual net profit (exclusive of outflows) excluding investments and interest rate: , where C13 is a sum of inflows of money resources, the range D2:D12 is outflows; B14 is the term of the investment project.
Done!

Data Visualization Charts for Interactive Report Creation in Excel.
Dashboard Templates