Chart for Effective Project Management in Excel
A beautiful chart template for project task management in Excel is one of the most convenient ways to visualize data. It allows you to clearly present project task stages and monitor their deadlines.
Beautiful Project Management Chart in Excel
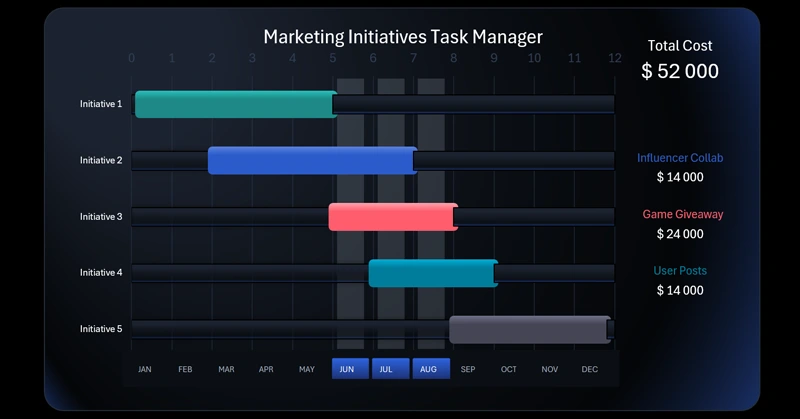
Project management requires strict control over tasks and deadlines. Excel’s data visualization capabilities allow us to create custom templates for such charts, as shown in this example. The chart-building process is explained in a step-by-step video tutorial. In this video, you’ll learn how to easily create this tool on your own:
- Excel features for drawing complex gradients for data visualization design.
- Formulas to extract source data from pivot tables.
- Excel pivot table slicers used as buttons to control the dashboard.
- Source table for building the Project Manager Chart in Excel.
- How to create a beautiful interactive Gantt-style bar chart in Excel without using macros.
- Cursor for convenient analysis of the project manager's marketing initiatives.
- Dynamic formulas for smart data labels on the visualization.
- Beautiful project timeline presentation in Excel for managing marketing initiative tasks.
Check out a practical example of using the chart for visual project task planning with a ready-to-use Excel dashboard template:
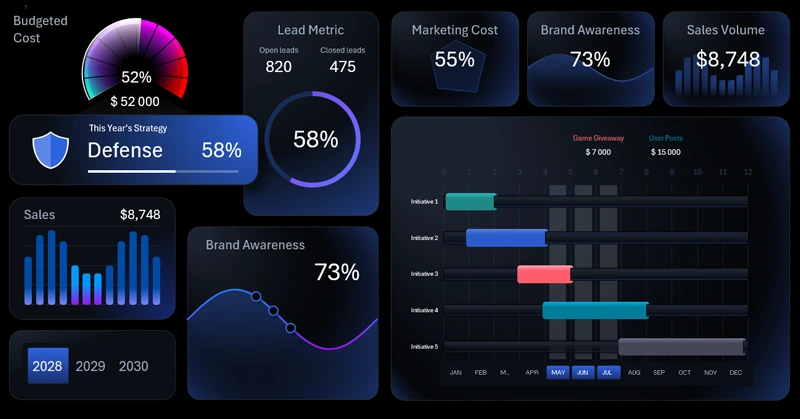
Interactive Marketing Strategy Presentation in Excel.
The Project Manager Chart in Excel is a simple and effective way to track the task execution sequence. It helps the team see the full picture, quickly detect delays, and promptly adjust the plan. This tool makes project management more transparent and efficient.


Data Visualization Charts for Interactive Report Creation in Excel.
Dashboard Templates