Excel Dashboard for Small Business Payroll Fund
The largest expense category in small businesses is employee salaries. Therefore, managing payroll costs is a key element of financial control. A well-structured dashboard in Excel allows you to track payroll distribution, evaluate and forecast cost efficiency, and identify key patterns in effective business management.
How Data Visualization Improves Management Efficiency in Excel

Expenses for employee motivation and workforce maintenance typically account for the largest portion of the operating budget. Data visualization in Excel helps transform raw payroll data into clear visual insights.
The dashboard user gains the ability to make more informed management decisions, which can always be presented to leadership to justify the rationale behind their actions. Specifically, it enables building connections between investments in personnel and the company’s strategic goals that impact overall business performance. This can be implemented across past periods using the full history of financial operations. You only need to specify the desired date range on the dashboard to select data for the reporting period.
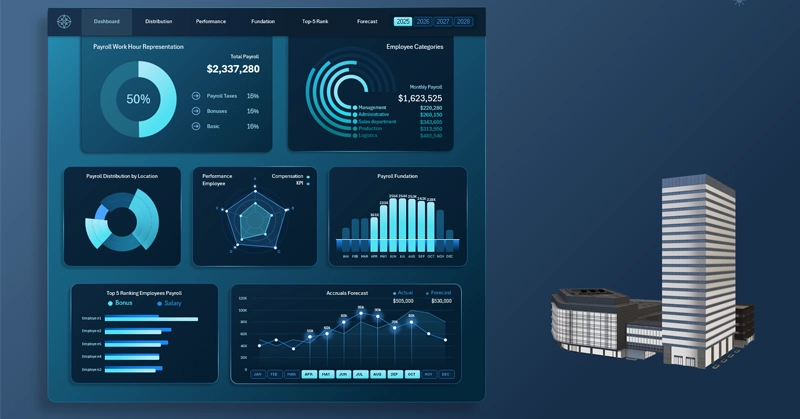
To build such a dashboard yourself in Excel, watch the training video, which demonstrates:
- Creating pivot tables from raw data
- Representation of working time in payroll calculations
- Adding filters – pivot table slicer buttons
- Employee categories – radial bar chart
- Payroll distribution by location – custom pie chart
- Employee performance – radar chart
- Payroll calculation basics – combined bar chart
- Payroll calculation for the top 5 employees – clustered bar chart
- Accruals – line chart
Review the guide for using this dashboard, which подробно explains each visualization block, its purpose, and interaction principles. A modern Excel dashboard with payroll expense breakdown, staff cost dynamics charts, and visual indicators.
How to use the payroll fund management dashboard in Excel
The template reflects the relationship between salary investments and key performance indicators, designed in a clean and structured analytical style. Therefore, the template structure extends across multiple screens, which can be navigated through the main menu for detailed analysis of each visualization block.
The payroll dashboard in Excel is not just a reporting tool, but a полноценная decision-support system for financial, HR, and management teams.
Despite the fact that the data visualization is fully implemented using standard Excel tools, it still provides structured data handling and intuitive visualization.
The Excel dashboard enables users to monitor cost efficiency, identify key cost drivers, and take timely management actions. This approach improves financial discipline and ensures more effective use of the payroll fund for sustainable business growth.
Download the ready-made template for free to learn in practice, visualize cost efficiency, and track the impact of salaries on business results in your reports.
 Download the Payroll Fund Dashboard template in Excel
Data Visualization Charts for Interactive Report Creation in Excel.
Dashboard Templates