Excel Payroll Dashboard Template for a Teal company
In self-managed organizations, data transparency and accessibility become the foundation of trust and efficiency. A payroll dashboard in Excel, designed in Teal style, combines rigorous analytics with an emotional component, helping not only to track financial metrics but also to foster conscious engagement with resource allocation within the team ecosystem. This approach makes reporting more understandable, engaging, and meaningful for all participants.
How to Combine Analytics and Emotional Value in Excel
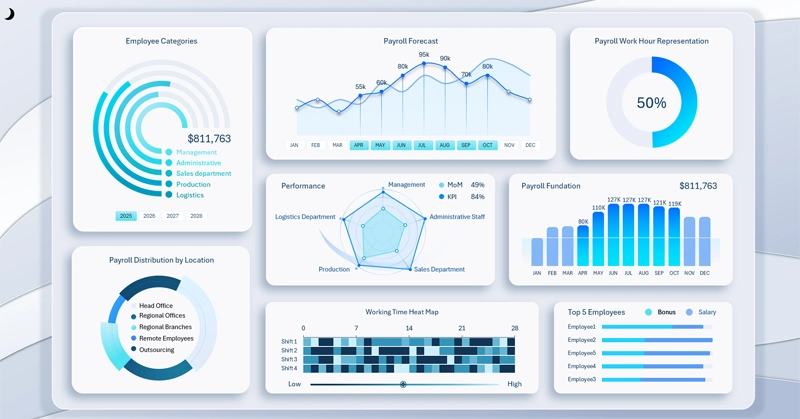
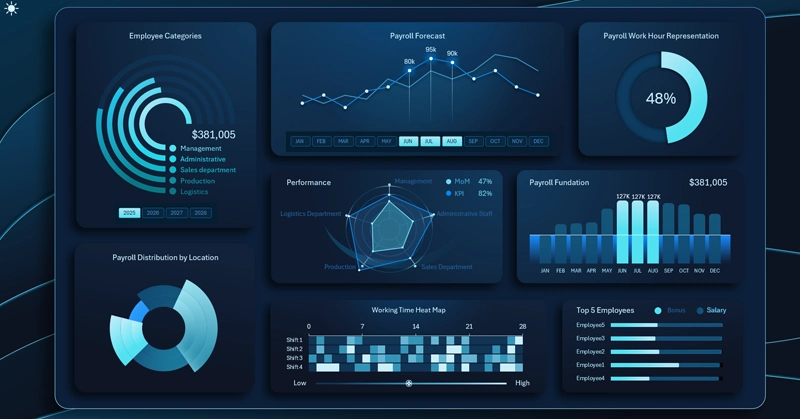
An Excel dashboard in Teal style visualizing the payroll fund structure and payment dynamics. It presents key performance indicators. The corporate design style is executed in a soft color palette with an emphasis on transparency and user engagement.
You can quickly learn how to create such dashboard templates in Excel yourself. One of Excel's main advantages is its low entry barrier and standardization of interchangeable data. To make developing visual reports as easy as possible, this template is built entirely with standard Excel tools without macros or plugin extensions, while fully retaining interactive functionality for managing dashboard data. This is implemented using pivot tables and pivot table slicer buttons. To see how such templates can be created in Excel in practice, download the ready-made template at the end of the article.
Additionally, a training video is provided where you will learn to:
- Create an abstract background design in Excel.
- Build a grid for visualization blocks on the dashboard.
- Set up and process source data for pivot tables.
- Prepare a formula table for the first interactive chart.
- Example of creating a radial bar chart in Excel.
- Use pivot table slicer buttons to control the dashboard.
- Design a stylish radial bar chart.
- Formula table for a line chart with interactive X-axis buttons.
- Interactive line chart for payroll growth forecast analysis.
- Stylish design for a standard chart – working time accounting.
- Combined bar chart with cursor – Payroll Fund.
- How to create circular grid lines for a Radar chart in Excel.
- Decorative design element using the shape editor.
- Attractive design for a Radar chart – KPI and MoM distribution.
- Multi-level data segmentation chart by categories.
- Chart with interactive sorting of rankings by two criteria: bonus and salary.
- Interactive heat map in Excel for analyzing work shift activity.
- Heat map progress bar for average results.
- Presentation of dashboard capabilities for interactive data visualization in Excel.
It is also important to study the principles of using the dashboard and the purpose of each visualization block:
Check the dashboard usage guide, which details each visualization block, its purpose, and interaction principles. A modern Excel dashboard with payroll expense breakdown, staff cost dynamics charts, and visual indicators.
Practical use of Excel payroll dashboard for Teal organizations
The Teal-style payroll dashboard design demonstrates that even traditional financial reporting can go beyond dry numbers. Add a visual layer of emotion to your practical analytics. Focus not only on practical but also on the emotional value of your product. By presenting your ideas to company employees, you give them a tool that not only informs but also strengthens a culture of openness and self-management. This enables teams to make more conscious decisions and reinforce collective responsibility for overall results.
 Download the Excel payroll dashboard for a Teal company in Excel

Data Visualization Charts for Interactive Report Creation in Excel.
Dashboard Templates