KPI Dashboard for Startup Analysis in Excel
The main problem with a startup isn't a lack of ideas — it's a lack of signals. Revenue gives you the answer too late; it's a lagging indicator. A KPI dashboard in Excel solves this differently: it surfaces leading metrics right now, lets you adjust plans on the fly, and reveals cause-and-effect relationships before they ever show up on your bottom line.
How to Manage KPI Growth When Data Is Still Scarce but the Stakes Are Already High

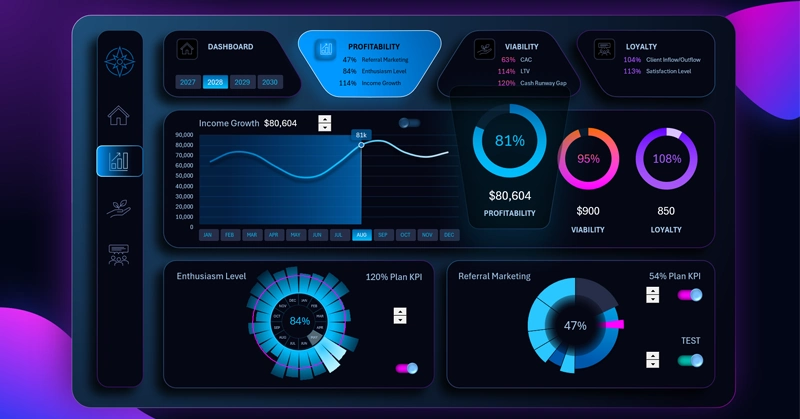
The main KPI dashboard screen: the blue curve shows actual revenue growth, the red diagonal line marks the 100% target plan, and the radar chart on the right shows the average completion rate across all KPIs for the selected period.
At the very beginning of any new project, no one ever knows:
- Whether the hypothesis is working or not.
- Whether the team is growing or burning out.
- Whether the business is moving toward sustainability or just simulating progress.
Three interactive report screens that replace your weekly standup:
- Project revenue growth.
- Survival metrics.
- Customer loyalty levels.
Want to learn how to build dashboards like this in Excel on your own? Use the video tutorial and the template file as a reference — both are available at the end of this article.
The video walks through every step of building the first screen:
- Creating custom shapes for dashboard design.
- New dashboard grid design in Excel.
- Menu for switching between dashboard panels.
- Interactive line chart for profit growth analysis.
- KPI plan level toggle on the line chart.
- New method for designing the main menu layout.
- Radar chart for analyzing team enthusiasm levels in Excel.
- Referral marketing progress chart.
- Presentation of KPI dashboard capabilities in Excel.
All charts across every dashboard screen are described in detail in the template usage guide:
How to Use the Dashboard to Drive Revenue Growth with KPIs in Excel
A KPI dashboard for a startup isn't about monitoring for its own sake. It's an early warning system: it sends a signal before a failure becomes obvious in the financial statements. When the team can see their metrics in motion, understands which actions drive results, and can adjust the plan without a three-hour meeting — the startup stops merely surviving and starts managing its growth with intention. Excel handles all of this without subscriptions or complex rollouts: one template, current data — and the picture becomes clear within the first week.
 Download the KPI Dashboard for Startup Analysis in Excel
Data Visualization Charts for Interactive Report Creation in Excel.
Dashboard Templates