Two Curves — One Philosophy on a Line Chart in Excel
In a traditional corporation, a bonus is a carrot and a stick: hit your sales target — get a bonus. In a teal organization, the logic is fundamentally different: a bonus isn't an incentive for short-term results, but a reward for long-term growth — both personal and business. This model calls for a different kind of visualization tool. The payroll forecast vs. actual chart in Excel doesn't just show "how much was paid out" — it shows how well the growth of the payroll fund tracks the planned trajectory of team development.
Visualizing the Correlation Between the KPI Plan and Actual Results
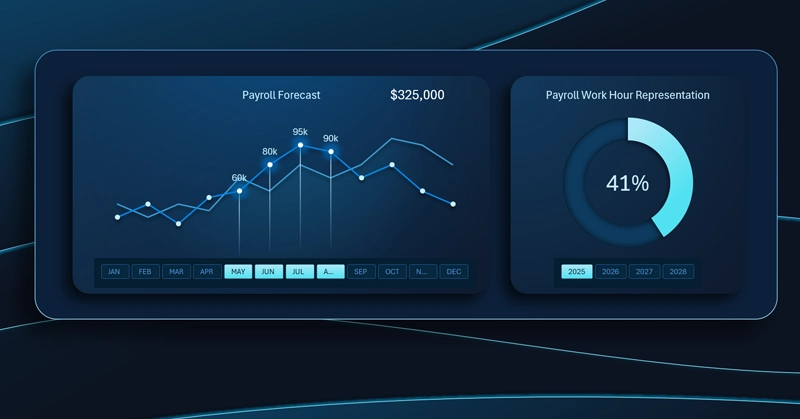
Plan vs. actual payroll line chart: the front curve shows the actual monthly payroll disbursements, the background curve shows the planned trajectory including performance bonuses; the interactive X-axis buttons control the entire dashboard and support multi-select by quarter.
What does the gap between the curves mean: when actuals fall behind the forecast — is that a signal of slowing growth, or just budget savings? For a comprehensive answer to these questions, read the following:

Excel Dashboard Template for a Self-Managed Organization
The payroll forecast vs. actual chart is a mirror of how mature a teal management model really is. If the actual curve consistently runs below the plan, that's not cause for the CFO to celebrate — it's a signal that employees aren't reaching the development levels built into the strategy. The reverse is equally telling: when the curves align or actuals outpace the plan, the bonus system is working as intended — people are growing, and the business is growing alongside them. This kind of interpretation is made possible by a well-constructed visualization in Excel — simple in form, but rich in meaning.
 Download the Most Beautiful Line Chart in Excel
Data Visualization Charts for Interactive Report Creation in Excel.
Dashboard Templates