Download examples of financial models in Excel
A collection of ready-to-use effective solutions for parsing. Charts, formulas, and functions for parsing and difficult monetary calculations.Financial models
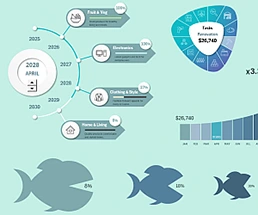 Project Management Dashboard in Excel with Infographics.
Download the business process management dashboard template in Excel. An interactive infographic with a dynamic gamified design for practical business scaling tasks.
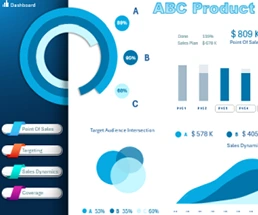 Download ABC Analysis of Product Sales in Excel Dashboard.
The interactive ABC Inventory Analysis Dashboard template for small businesses. An example of how ABC Analysis can be effectively used to build a product assortment.
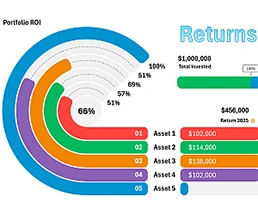 Investment Tracker Dashboard for Portfolio Manage in Excel.
Download the dashboard template for monitoring the return on investment for the assets of a general portfolio. Here’s an example of how to invest in 10 income sources to create a portfolio with a payback period of up to 10 years.
 3 Examples ABC Analysis with 3D Infographic Charts in Excel.
Download a Template for Comparing Financial Metrics Across Different ABC Analyses An example of using PowerPoint to create stunning 3D infographics from shapes and charts in Excel.
 Animated Excel infographic of financial stability portfolio.
Download the infographic template with interactive animation for presenting the personal financial preservation investment portfolio. Presentation of a financial stability strategy for private investors.
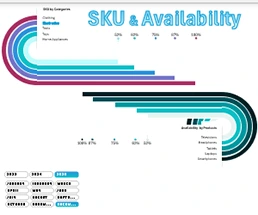 How to Make SKU and Availability Mini Dashboard in Excel.
Download a mini dashboard template to create reports on SKU and product availability metrics in Excel. How to quickly create dashboards using a template. A chart design builder method with interactive data visualization.
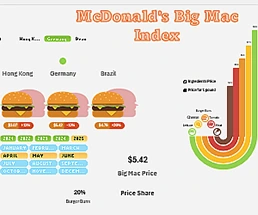 Excel Infographic Big Mac Index with Borscht Set Pricing.
An engaging presentation on calculating the Big Mac Index using the Borscht Set Index formula. How can we accurately assess inflation and purchasing power? Download this interactive infographic to analyze product pricing based on ingredient costs.
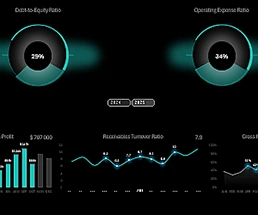 Download Dashboard Company Financial Stability in Excel.
A free tool for monitoring key financial stability indicators of your business. Download the template with examples of formulas for interactive data visualization on a dashboard.
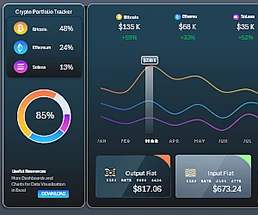 Download Excel Dashboard Cryptocurrency Portfolio Tracker.
A presentation template for tracking the profitability of a cryptocurrency portfolio in Excel. Features two design modes, simplified formulas, ease of use, and easily updated source data.
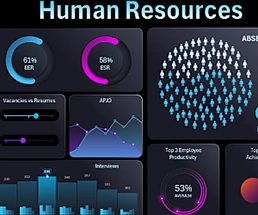 Interactive Human Resources Dashboard template in Excel.
An example of an interactive dashboard for an HR manager. Stylish HR management interface design. Visual analysis of key employee performance indicators.
Excel Dashboard Templates for Business

Data Visualization Charts for Interactive Report Creation in Excel.
Dashboard Templates