Energy Excel Dashboard for a Bakery
In bakery production, margins rarely exceed 20% — and that's exactly why energy costs make or break the business. Cutting gas and electricity consumption by just 25% can literally double net profit without selling a single extra loaf. But to get there, you need to see the numbers in real time, by each oven, for every month. That's precisely what a multi-level energy dashboard in Excel does — it turns energy bills into a manageable line item rather than an unavoidable overhead.
How to Cut Gas and Electricity Costs Using Excel
A dashboard example that clearly shows how you can reduce gas and electricity expenses — and double your profit without growing revenue.
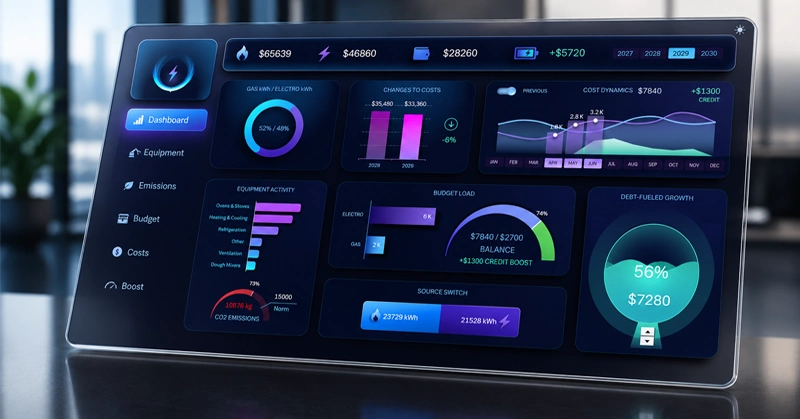
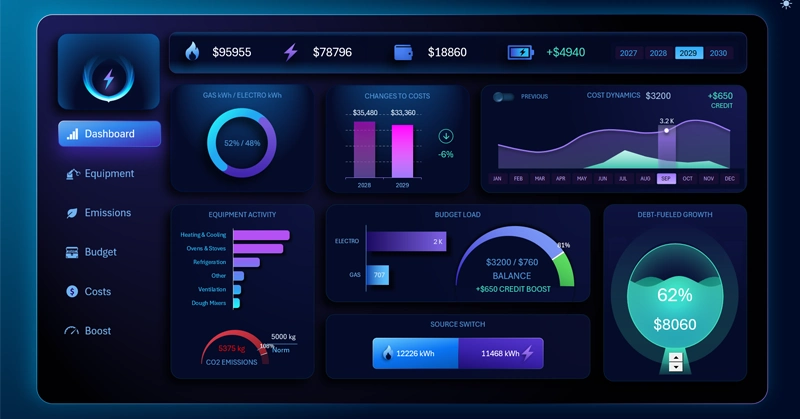
What a bakery owner sees on the dashboard: from a ranking of the most energy-hungry equipment to the remaining budget balance including the credit reserve.
The main screen of the energy dashboard: on the left — the share of gas and electricity in total consumption; in the center — monthly expense trends with the prior-year comparison line; on the right — equipment ranking and a CO2 emissions indicator.
How do you build this kind of dashboard on your own? Watch the tutorial video below, which covers:
- The design grid for the energy consumption monitoring panel.
- Main menu settings.
- Energy source toggle: gas / electricity.
- Summary pie chart showing energy source distribution.
- Current year vs. prior year expenses.
- Expense trend chart.
- Switching the line chart to show the prior-period expense trend.
- Bakery equipment energy consumption ranking.
- Speedometer chart for CO2 emissions monitoring.
- Budget spending control indicator.
- Bar chart for comparative analysis of gas and electricity costs.
- Customizable animated chart for credit utilization analysis.
We also recommend reviewing the detailed description of all charts on the dashboard:
How an Excel Dashboard Helps Increase Bakery Profit by +100%
An energy dashboard isn't a report for the accountant — it's an operational management tool for the owner. When you can see on a single screen which oven is consuming a third of your budget, which quarter historically pushes costs out of range, and how much credit reserve remains before the period ends — decisions get made faster and with greater precision. Excel handles this without expensive software: all it takes is a well-structured model built on pivot tables and dynamic formulas. The template can be adapted to any bakery — small, chain, or production facility — simply by replacing the source data and utility rates on the DATA sheet.
 Download the Energy Dashboard in Excel
Data Visualization Charts for Interactive Report Creation in Excel.
Dashboard Templates