Business Data Charts: Practical Examples for Excel Dashboards
Business data charts transform raw numbers into actionable insights. Well-designed visualizations help leaders identify trends, monitor KPIs, and make confident strategic decisions based on structured analytics rather than assumptions in Excel Dashboards.How Visual Data Improves Strategic Business Decisions in Excel
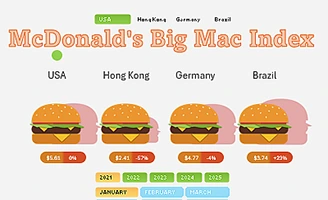 Interactive Excel Presentation for Big Mac Index.
Explore an unusual approach to calculating the Big Mac Index with this engaging Excel infographic. Presentation on the topic: How to form an economic inflation index based on the analysis of burger ingredient prices?
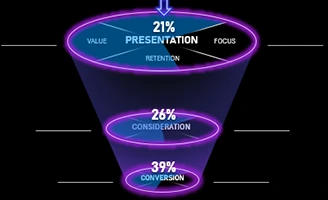 Sales Funnel Chart in Excel Download Example Template.
Learn how to create a sales funnel chart in Excel with this easy video tutorial. From setting up your data to creating a professional visual design for your chart.
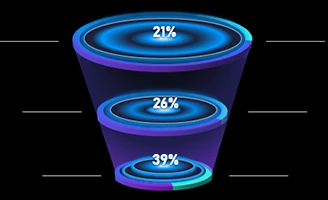 Sales Funnel in Excel Download Template.
Free template, tips and step-by-step instructions for creating professional sales funnel visuals for presentations. The chart is perfect for marketers, analysts and anyone who wants to improve sales reporting.
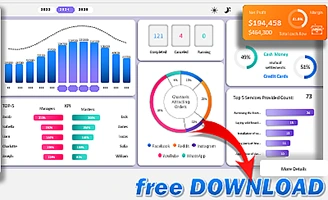 Video Course: How to Create KPI Charts for Excel Dashboard.
Download free chart and diagram templates for KPI presentation in Excel. Educational, free, seven-hour video course is ideal for business professionals who need effective and customizable reporting tools.
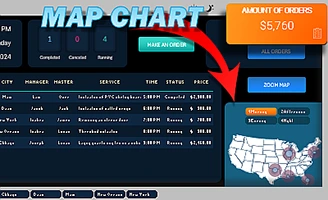 Quickly a Map Chart for Dashboard in Excel Template.
Two easy ways to build geographic map charts for data visualization. Step-by-Step Guide to Creating Interactive Map Charts. Download free map chart templates for example and learning.
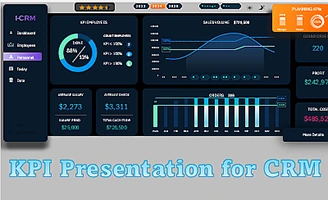 KPI Dashboard for a CRM System in Excel Template.
An example of developing a presentation of KPI indicators for use in CRM systems created in the MS Excel application. Effective analysis of key indicators on interactive data visualization.
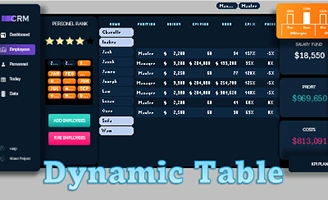 Dynamic Tables and Charts for CRM Dashboard in Excel.
Learn how to create dynamic tables and charts for CRM dashboards in Excel without macros while automating data structuring. Download Dynamic Table Example Template in Excel.
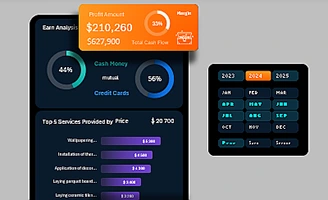 Dynamic Charts for a CRM Dashboard in Excel Template.
Example of how to create an interactive data visualization template for dynamic dashboards without macros to enhance business analysis efficiency in Excel.
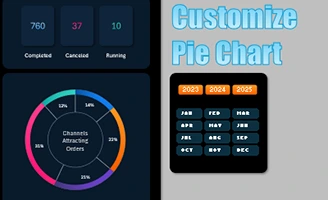 Design a Doughnut Chart with Percentages in Excel.
This video provides a step-by-step guide on customizing a doughnut chart design in Excel with percentage display. Download the customized chart template for reference.
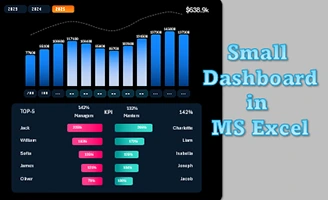 Small Dashboard for KPI and Sales Correlation in Excel.
This template will help you gain a clear understanding of the impact of your KPIs on sales performance and quickly identify the best growth points.
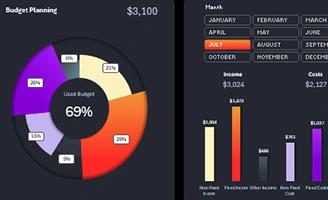
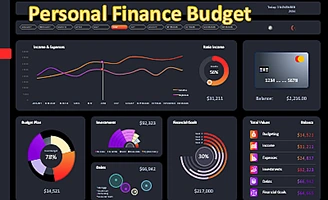 Personal Finance Budget Excel Dashboard Template.
Easily track your income and expenses with this dashboard template. Get an overall financial picture of your personal finances in Excel. Download a template for a sample presentation.
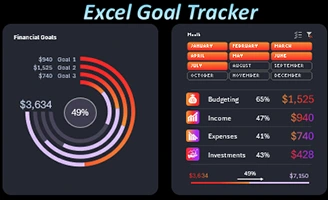
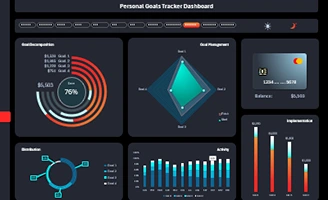 Financial Goals Tracking Dashboard in Excel Template.
Video tutorial on developing an Excel presentation of progress towards achieving personal financial goals. Pivot table data structure, dynamic charts and graphs, controls for interactive interaction with the template.
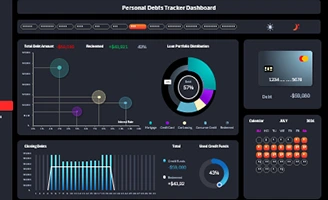 Debt Repayment Tracking Dashboard in Excel Template.
The tutorial presents how to create an interactive panel for managing loan debts. Close your debts easily, safely, and enjoyably, making it easier for you to achieve your financial goals.
 Personal Wealth Monitoring Dashboard in Excel Template.
Creating a monitoring dashboard in Excel will allow you to easily track your assets and liabilities and get an overview of your financial standing.
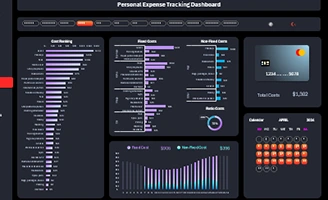 Personal Expense Tracker Dashboard in Excel Template.
A simple yet useful dashboard for tracking personal expenses in Excel. Step-by-step video guide for organizing data, building pivot tables and charts, and using interesting Excel formulas for analyzing your spending.
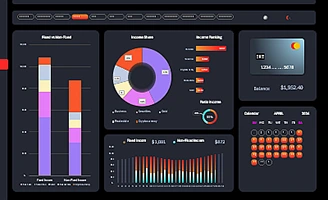 Personal income tracker dashboard in Excel Template.
How to create a personalized dashboard for tracking your income in Excel? A step-by-step guide to setting up visualization using charts and leveraging Excel's built-in functions for automating calculations.
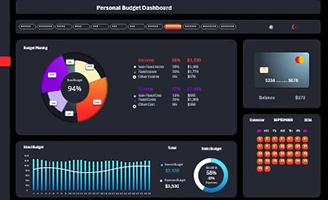 Personal Budget Dashboard in Excel Template.
Learn how to create a personal budget dashboard in Excel. Discover how to visualize income, expenses, and financial goals using charts and graphs to better manage your finances.
 Progress Bar to Track Goals in Excel Template.
Watch a video example on how to create multi progress bars for visually tracking goal achievement using Excel charts. Step-by-step instructions and a ready-to-download template included.
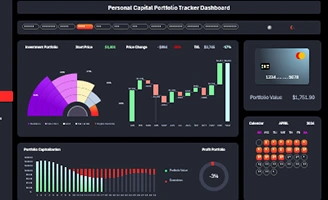
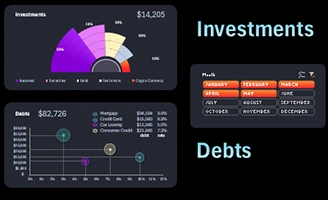 Investment vs Debt Report Excel Presentation Template.
Video tutorial on creating an investment and debt report presentation in Excel. Learn how to efficiently structure data, add charts, and make financial analysis visually clear for decision-making.
 Multi-Level Donut Chart in Excel Template.
A video tutorial with a step-by-step example of creating a dynamic multi-level chart in Excel. How to easily customize a chart to effectively display multiple data points at once in an easy-to-read format.

Data Visualization Charts for Interactive Report Creation in Excel.
Dashboard Templates