Interactive Data Visualization in Excel for Reports
Interactive visualization in Excel allows you to analyze information flexibly and efficiently. With slicers, dropdown lists, and dynamic charts, you can quickly identify trends and make decisions based on current metrics.
Template Collection for Presenting Reports in Excel
Interactive tools help create personalized reports for different management levels, simplify comparisons of data across periods, and improve the accuracy of forecasts. Users can immediately see the impact of changes on key metrics, identify bottlenecks, and optimize processes, making data analysis more transparent and effective.
 Excel Dashboard for Compare of Income married Men vs Women.
Analyze income differences by marital status with an Excel dashboard. Discover why married men earn more than single men or women. Download Excel Dashboard for comparing Income.
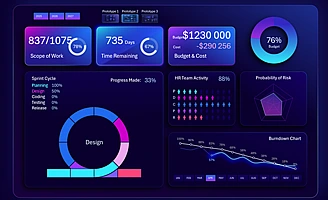 Excel Agile Project Management Dashboard for Development.
Download the Excel dashboard template for Agile project management in personal finance app development. Includes interactive sprint cycle chart and burndown graph.
 Spaghetti Line Chart for a Mini-Dashboard in Excel.
Interactive spaghetti line chart template for a small dashboard. An effective way to visualize the dynamics of multiple metrics with the ability to temporarily hide lines on the chart.
 Beautiful Radar Chart with interactive design in Excel.
Download the template to build an interactive radar chart with functional design in Excel. This chart will help compare metrics and visually enhance data perception in reports.
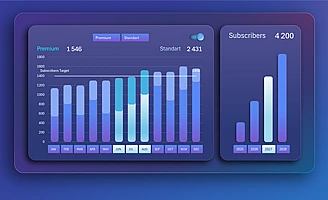 Pivot Stacked Bar Chart with Data Switching in Excel.
Download the template to build a stacked bar chart with switching option in Excel. Interactive visualization will help compare metrics and analyze changes over time.
 Interactive Excel Line Chart with data switching option.
Download the template to build an interactive line chart in Excel with a switching option. A simple solution for visualizing and comparing metrics in one line chart.
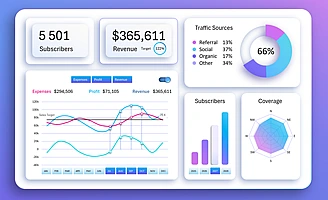 Example of Excel BI Dashboard for sales business planning.
Download the business intelligence-style dashboard template. The dashboard will help effectively structure data, analyze metrics, and visually present results.
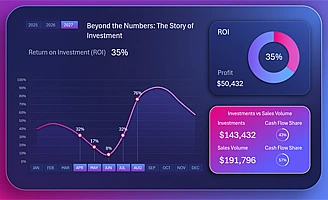 Mini dashboard for investment return stories in Excel.
Download the mini dashboard template in Excel to track monthly investment returns throughout the year. Interactive line chart and ROI diagram for presenting success stories.
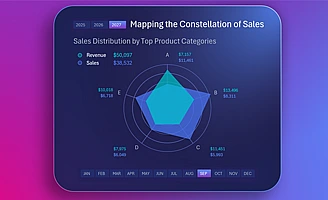 Excel radar chart for visualizing sales by products.
Download the radar chart template for analyzing the sales horizon by product categories in Excel. A clear visualization of the product distribution structure for dashboards.
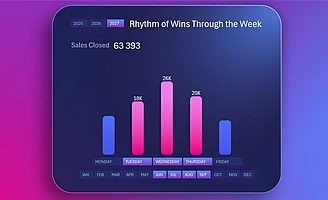 Weekly chart for analyzing closed deals in Excel.
Download the interactive bar chart in Excel for visualizing the flow of closed sales deals by workdays. Stylish bar chart design with rounded columns.
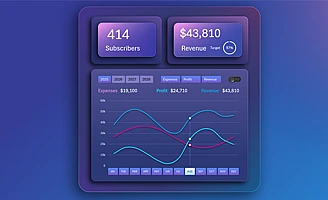
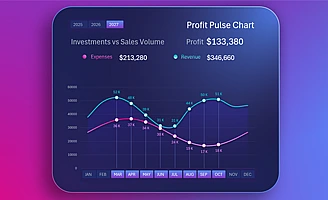 Tracking profit flow by income and expenses in Excel.
Download the interactive line chart for profit flow analysis. An example of how to build charts for analyzing income and expense flow dynamics in Excel.
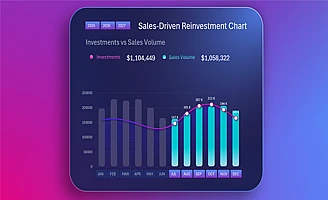 Bar chart for analyzing reinvestments on sales in Excel.
Download the Excel reinvestment data visualization block template based on sales. It allows you to control purchase payback from sales for effective planning.
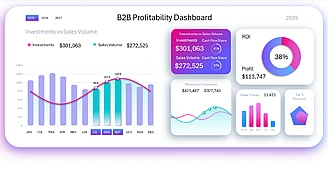 Excel ROI dashboard for product purchase profitability.
Download the interactive Excel dashboard template for investment ROI analysis in product purchasing. Profitability and purchasing planning control for B2B business models.
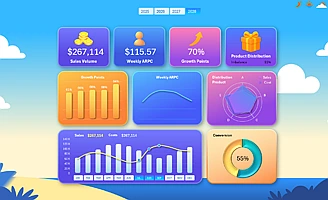 Excel Sales report with game-inspired visualization design.
Download the interactive sales report with gamification in Excel. A unique dashboard with game elements for engaging analysis of boring reports.
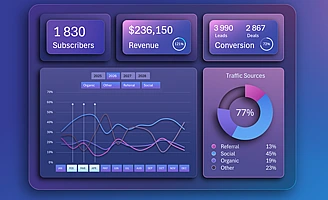
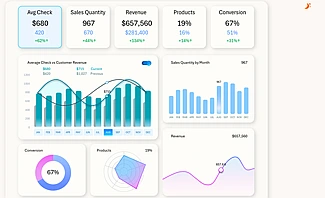 Dashboard for comparative sales analysis by year in Excel.
Interactive Excel dashboard for comparing monthly metrics by year. Revenue, product distribution, average check, and conversion in one template — free download.
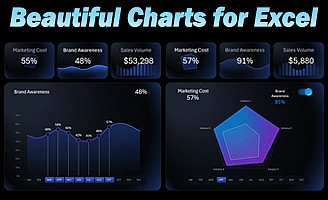 Templates of Interactive Excel Charts with Beautiful Design.
Download ready-made Excel chart templates to learn how to create interactive charts with stunning design. Make your data visualization user-friendly, impactful, and aesthetically pleasing.
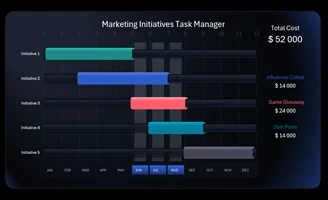 Chart for Effective Project Management in Excel.
Gantt-style chart template for managing project tasks in Excel. A visual tool that helps track task stages, deadlines, and progress for Dashboard.
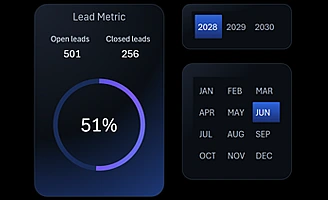 Beautiful Pie Chart for Beginner Designers in Excel.
A template for creating a stylish pie chart in Excel to effectively present the lead-to-sale conversion rate. A simple and effective way to visualize data with a beautiful design.
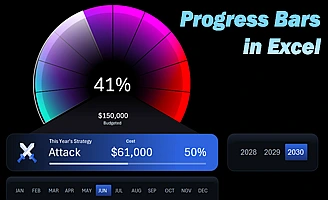 2 Progress Bars to Compare Budget and Timeline in Excel.
An example of how to use two progress bars in Excel for a comparative analysis of budget usage versus planned timelines. A simple way to visually track project progress.
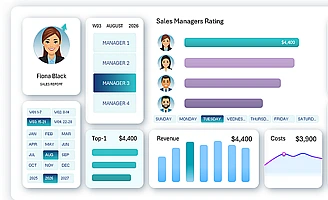 Excel Dashboard Report for Weekly Sales Team Meetings.
Simplify your weekly meeting prep with this Excel dashboard. Analyze sales performance, identify trends, and make informed decisions based on data visualization.

Data Visualization Charts for Interactive Report Creation in Excel.
Dashboard Templates