Beautiful design for charts and dashboards in Excel
Examples of how to create stylish designs for impactful dashboards with interactive charts in Excel. Template files with elegant Excel presentations of data visualization built on pivot tables.
Download interactive dashboards in Excel format
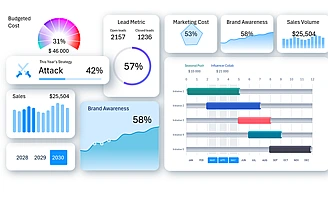 Excel Template for Visualizing Brand Marketing Strategy.
Use this clear Excel dashboard example to analyze your brand’s marketing strategy. The ready-made template helps visualize key KPIs and promotion channels.
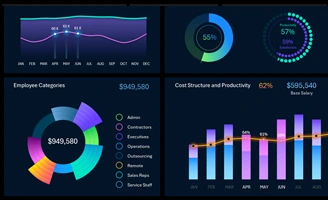
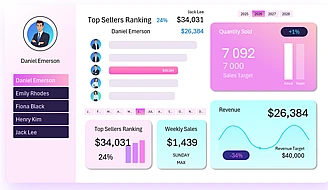 Excel Sales Performance Report Template for Salespeople.
This ready-to-use dashboard will help you track salesperson performance, analyze sales, and identify your top performers. Boost team motivation with visual reports in Excel.
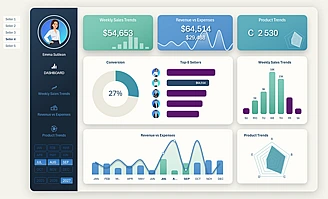 Excel Salesperson Evaluation Dashboard for Retail Stores.
A beautiful example of an Excel dashboard for analyzing salesperson performance in POS systems. This data visualization template will help simplify reporting and improve sales team efficiency.
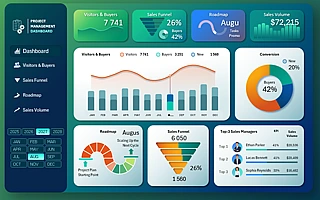 Beautiful Project Management Dashboard in Excel Template.
Download the free interactive dashboard template for managing your sales project in Excel. Track stages, tasks, deadlines, and progress all in one visual report.
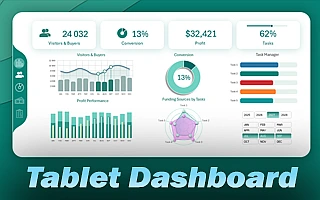 Download the portable Excel Dashboard for tablet use.
User-friendly Excel dashboard design for managing business projects from a tablet. Track tasks, resource allocation, conversions, income and expenses, deadlines, and progress directly from your mobile device.
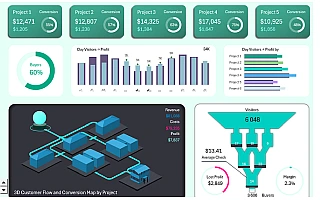 3D dashboard for project management in Excel Template.
This free dashboard template with a 3D project map will help you organize management tasks, track progress, and analyze results — all in one place.
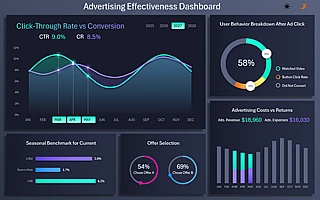 Advertising Campaign Analysis Dashboard in Excel.
Measure advertising effectiveness using an interactive dashboard. Learn how to create templates that visualize reach, clicks, conversions, and ROI in Excel — all in a format that works for you.
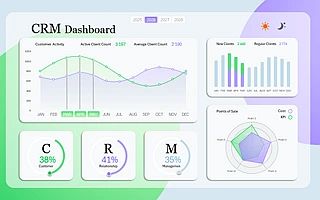 Beautiful CRM Report Dashboard Template in Excel.
Free Download a beautiful CRM report dashboard template in Excel. Visualize sales conversion, client efficiency, KPI and activity in one report.
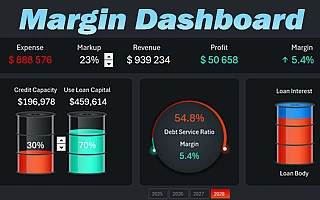 Credit Impact on Margin Dashboard in Excel Template.
An example of how to use an Excel dashboard to analyze the impact of credit on business margin. Download the visualization and ready-made template for financial decision-making.
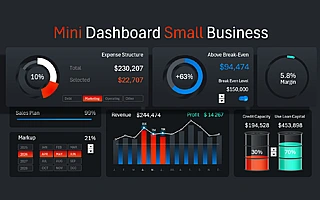 Quick credit usage analysis for small business in Excel.
This mini-dashboard in Excel will help you quickly assess the efficiency of credit usage and control debt load. Minimal data – maximum value.
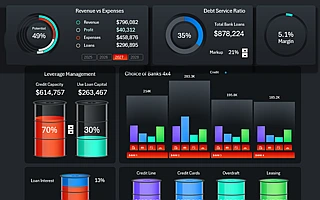 Choosing a bank for small business with an Excel dashboard.
Use this Excel dashboard to evaluate various banking services and simulate potential loans. Improve financial decision-making for your small business.
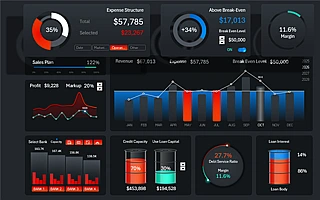 Download Excel Dashboard for Credit Impact on Business.
Track how credit impacts small business profitability with the Excel dashboard. An interactive template for assessing margin, payments, and financial stability.
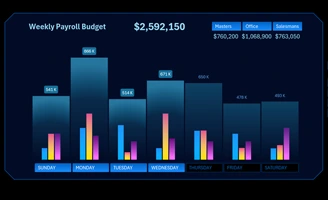 Dynamic Weekly Chart Template in Excel Template.
Excel template with a dynamic weekly chart. Great for analyzing grouped data. Example of interactive data visualization by day of the week. Automatically updates based on the selected week.
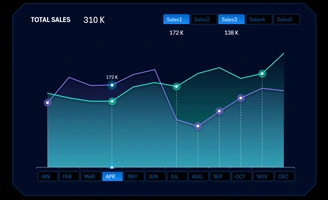 Growth Sales Point Tracker Chart in Excel Template.
Example Excel template for analyzing and tracking sales growth points. A convenient combined chart that visualizes the dynamics of key metrics and growth trends across different directions.
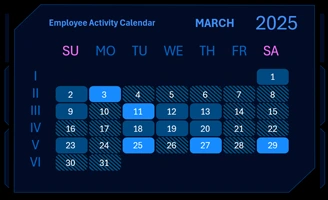 Interactive Calendar with Heatmap in Excel Template.
A free sample template of an interactive calendar with a heatmap for Excel reports. Perfect for presenting activity tracking, employee workload, vacations, overtime, and work hours.
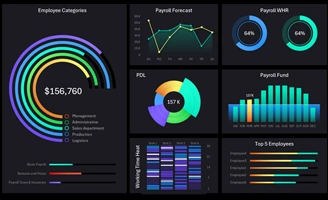
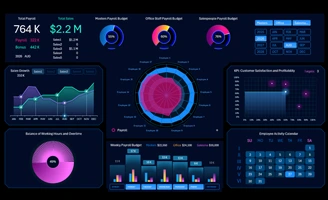 Excel Dashboard for Payroll Management in Small Business.
Download the dashboard for payroll tracking and analysis in small business. Data visualization for an interactive report: employee KPIs and payroll expense control.
 Top 3 Beautiful Pie Chart Designs in Excel Template.
Examples of how to design Pie Charts in Excel — 3 best design options. Improve data perception with beautiful visualization styles for standard charts.
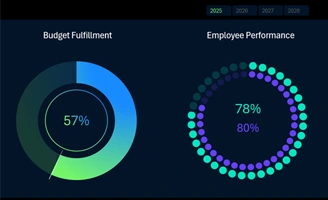
 Excel Dashboard for Employee Performance Report.
Sample dashboard template for employee performance evaluation in Excel. A convenient interactive report for HR and managers: metrics, charts, and graphs.
 Payroll Report Presentation Template in Excel Template.
Ready-to-use payroll report presentation template in Excel. Convenient structure, infographics, and clear charts to present salary data effectively.
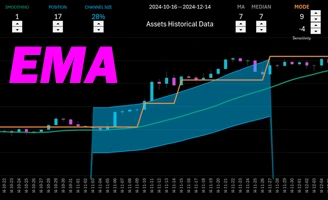 Exponential Moving Average Example in Excel Template.
How to build an Exponential Moving Average (EMA) in Excel using a simple formula. Add a trendline to the chart without macros or third-party add-ins.

Data Visualization Charts for Interactive Report Creation in Excel.
Dashboard Templates